Temporal Trends and Disparities in Liver Cell Carcinoma and Hepatic Failure Mortality in the United States: A 24-Year Analysis from CDC WONDER, 1999-2023
DOI:
https://doi.org/10.71079/ASIDE.GI.072726719Abstract
Background: Liver cell carcinoma (LCC) and hepatic failure (HF) are significant contributors to liver-related mortality in the United States. This study assessed LCC- and HF-related mortality trends (1999–2023) using CDC WONDER data, stratified by demographics and geography.
Methods: Deaths among U.S. adults aged ≥25 years with LCC (ICD-10: C22.0) or HF (ICD-10: K72.9) as underlying or contributing causes were analyzed. AAMRs per 1,000,000 were calculated by direct standardization to the 2000 U.S. standard population. Joinpoint regression estimated annual percent changes (APCs) in AAMRs, stratified by sex (1999–2023) and race/ethnicity, urban-rural status, census region, and state (1999–2020).
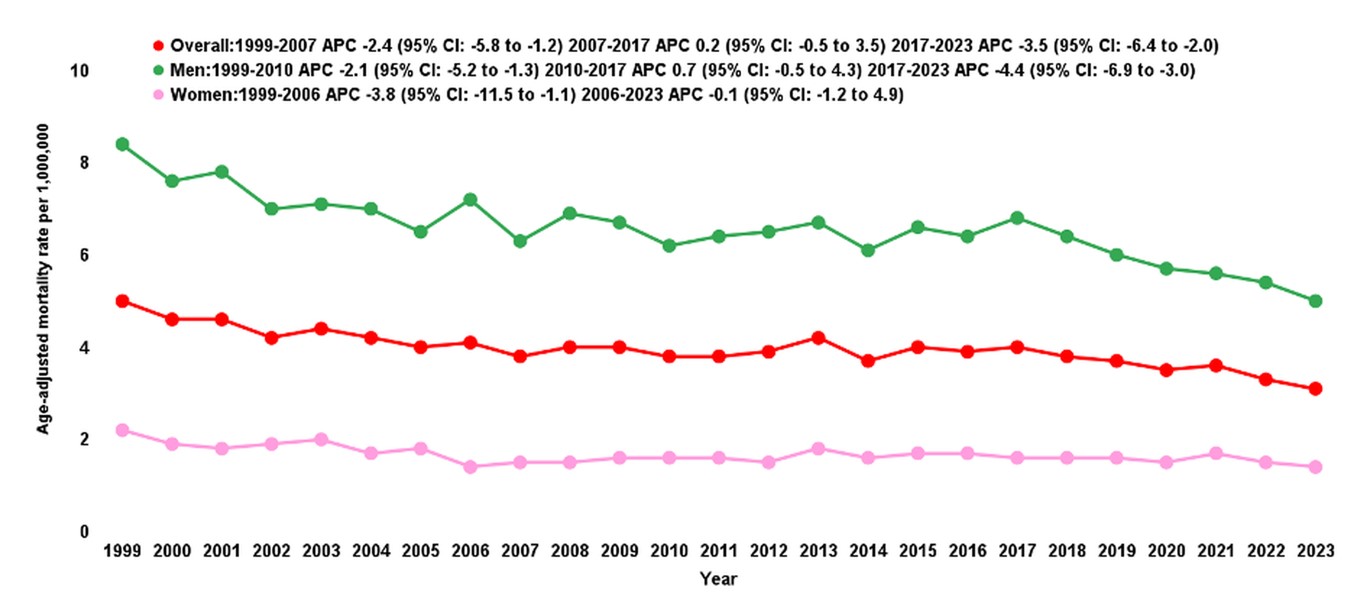
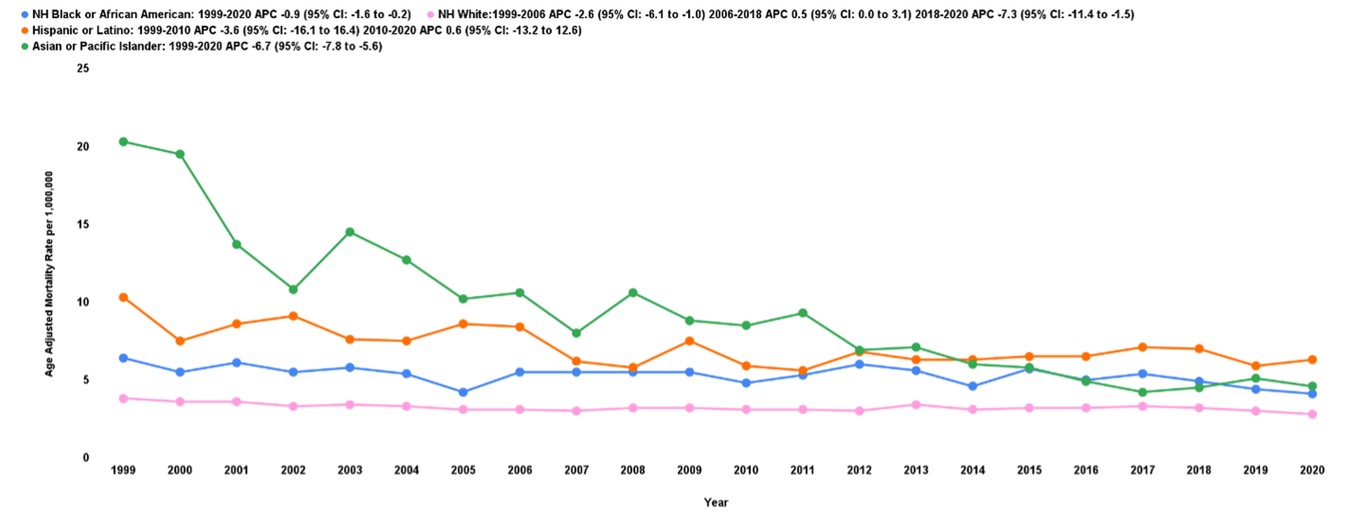
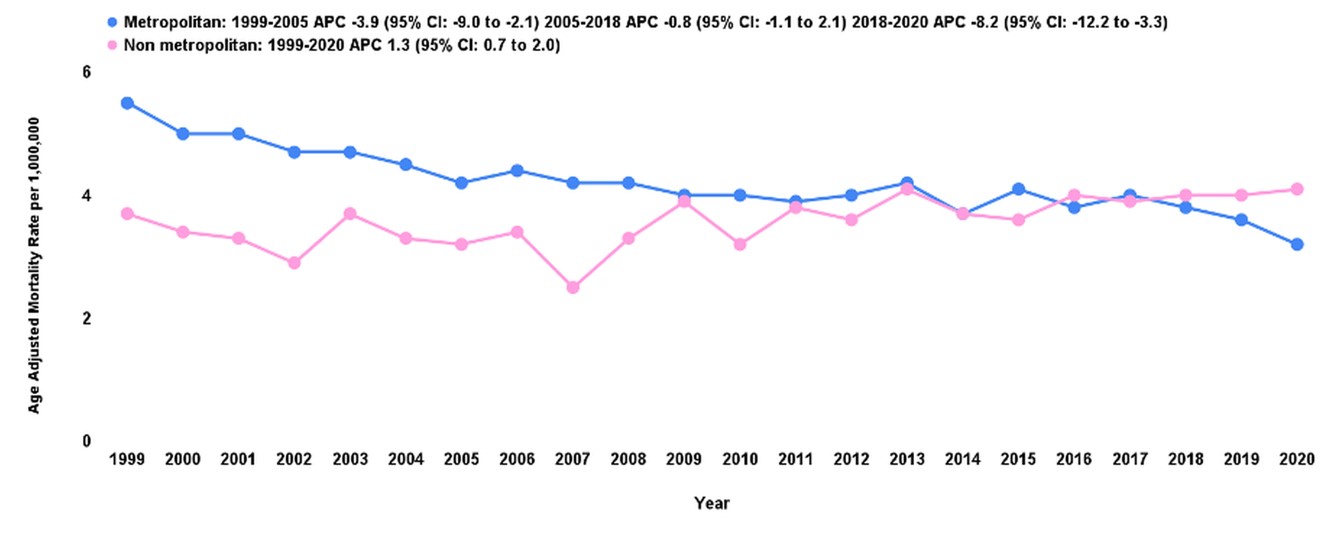
Results: From 1999–2023, 22,963 adult deaths were recorded (77.6% men). Overall AAMR declined from 1999–2007 (APC: −2.4), was stable through 2017 (APC: +0.2), then fell through 2023 (APC: −3.5). Male AAMR followed a non-linear trajectory (APC: −2.1, 1999–2010; +0.7, 2010–2017; −4.4, 2017–2023); female AAMR was stable post-2006 (APC: −0.1). NH Asian or Pacific Islanders showed the steepest decline (APC: −6.7); Hispanics increased post-2010 (APC: +0.6). Metropolitan AAMR declined overall; non-metropolitan AAMR increased (APC: +1.3). The West had the highest regional AAMR (5.6 per 1,000,000); Hawaii the highest state-level AAMR (10.3 per 1,000,000).
Conclusion: LCC- and HF-related mortality declined overall, with descriptive subgroup variation by sex, race/ethnicity, urbanization, and geography. Targeted screening, hepatitis management, and equitable healthcare access are needed to address these patterns.
Keywords:
Liver cell carcinoma, Hepatic failure, Mortality trends, Temporal trends, EpidemiologyFull Text
Introduction
Liver cell carcinoma (LCC), predominantly represented by hepatocellular carcinoma (HCC), along with hepatic failure (HF), continues to significantly impact global morbidity and mortality, presenting substantial challenges to healthcare systems worldwide. HCC remains among the most prevalent malignancies, ranking sixth globally in cancer incidence and fourth in cancer-related mortality, reflecting its aggressive nature, late-stage detection, and limited curative treatments [1]. Additionally, unspecified hepatic failure (ICD-10: K72.9) – a condition of severe hepatic decompensation reflecting diverse etiologies – places substantial demands on healthcare systems through high hospitalization rates, intensive care needs, and considerable patient morbidity [2]. This analysis uses K72.9 as the hepatic failure component of the combined endpoint; the acute (K72.0) and chronic (K72.1) subtypes were not captured separately, which is acknowledged as a limitation.
Despite considerable progress in diagnostics, including advanced imaging modalities, biomarker development, and improved screening strategies, as well as therapeutic innovations such as targeted molecular therapies, immunotherapy, and liver transplantation, marked disparities in mortality persist among various populations [3,4]. These disparities frequently reflect complex interactions of socioeconomic status, racial and ethnic differences, gender-related risk factors, geographic variability, and differential access to healthcare services [5]. Identifying and characterizing these disparities are thus imperative for tailoring interventions, reducing inequities, and improving overall patient outcomes.
To address these knowledge gaps, we leveraged the CDC WONDER (Centers for Disease Control and Prevention Wide-Ranging Online Data for Epidemiologic Research) platform to conduct a 24-year national analysis of LCC- and HF-related mortality spanning 1999 to 2023. CDC WONDER offers a uniquely comprehensive, continuously updated repository of U.S. vital statistics data derived from death certificates filed across all 50 states and the District of Columbia, making it well-suited for longitudinal epidemiological surveillance of rare and chronic conditions [6].
We characterize mortality patterns through AAMRs and APCs stratified by sex, race/ethnicity, urban-rural status, U.S. census region, and state. This multidimensional approach allows identification of periods of accelerated change and of demographic or geographic subgroups bearing a disproportionate share of liver-related mortality, thereby highlighting priority areas for clinical and public health action.
Insights generated from this research not only augment existing knowledge but also serve as a critical evidence base for clinicians, public health authorities, and policymakers. By understanding nuanced patterns in liver disease-related mortality and recognizing high-risk populations and geographic disparities, stakeholders can develop targeted screening programs, refine clinical guidelines, enhance healthcare delivery, and implement policy initiatives to reduce the overall burden of liver-related diseases in the United States.
Methods
Study design and population
We conducted a cross-sectional descriptive analysis of mortality data drawn from the CDC WONDER (Centers for Disease Control and Prevention Wide-Ranging Online Data for Epidemiologic Research) database [7]. The study examined deaths among U.S. adults aged 25 years and older from 1999 through 2023 in which liver cell carcinoma (LCC; ICD-10: C22.0) or hepatic failure (HF; ICD-10: K72.9) was documented as either the underlying or a contributing cause of death. LCC and HF were analyzed as a combined endpoint because hepatic failure frequently represents a terminal sequela of advanced liver malignancy, and prior CDC WONDER – based surveillance analyses have employed this combined approach to characterize liver-related mortality across demographic and geographic strata (13). We acknowledge that LCC and HF are clinically distinct entities; the implications of this combined construct are addressed in the Limitations section. The ICD-10 code K72.9 (hepatic failure, unspecified) was selected as the most frequently assigned hepatic failure code in death certificate data; it does not distinguish between acute and chronic forms of hepatic failure, which is an additional limitation discussed below. The restriction to adults aged 25 years reflects the epidemiological distribution of these conditions, which are exceedingly rare before age 25 and for which stable age-adjusted rates cannot be computed in the CDC WONDER framework. Because the study relied exclusively on de-identified, publicly accessible federal data, institutional review board (IRB) review was not required. The dataset encompassed death records from all 50 states and the District of Columbia. Reporting adhered to the Strengthening the Reporting of Observational Studies in Epidemiology (STROBE) guidelines [8].
Data extraction
Population-level variables extracted from the database encompassed demographic characteristics (sex and race/ethnicity), geographic identifiers (state, census region, and urban-rural category), and corresponding population denominators. Sex-stratified and national aggregate trend data covered the full 1999 – 2023 observation window. Race/ethnicity-, region-, urbanization-, and state-level data extended only through 2020, as disaggregated subgroup records beyond that year were not available in the publicly released Multiple Cause of Death files at the time of analysis; this discrepancy between the gender/overall analysis window (1999 – 2023) and subgroup analyses (1999 – 2020) is explicitly noted throughout the manuscript. Race/ethnicity analyses were restricted to four groups with sufficient non-suppressed data across the observation window: Non-Hispanic (NH) White, NH Black or African American, Hispanic or Latino, and NH Asian or Pacific Islander. Data cells with fewer than 10 deaths were suppressed per CDC WONDER policy and were excluded from rate calculations; suppressed strata were not imputed.
County-level urbanization was classified according to the 2013 NCHS Urban-Rural Classification Scheme for Counties [9]: jurisdictions with 1,000,000 residents were designated large metropolitan, those with 50,000 – 999,999 residents as medium or small metropolitan, and those with fewer than 50,000 as non-metropolitan. Geographic region followed the U.S. Census Bureau’s four-division taxonomy: Northeast, Midwest, South, and West. The 2013 classification scheme was applied as a fixed cross-sectional schema throughout the 1999 – 2020 observation period; changes in county urbanization status between 1999 and 2020 were not accounted for in the primary analyses, which is acknowledged as a limitation.
Statistical analysis
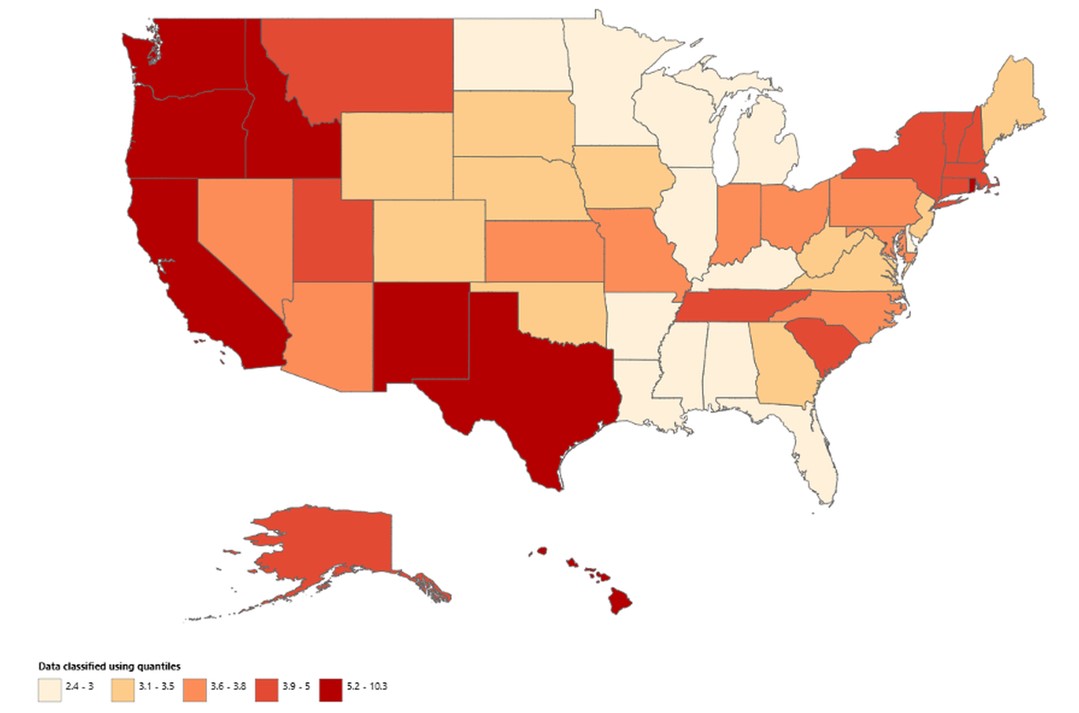
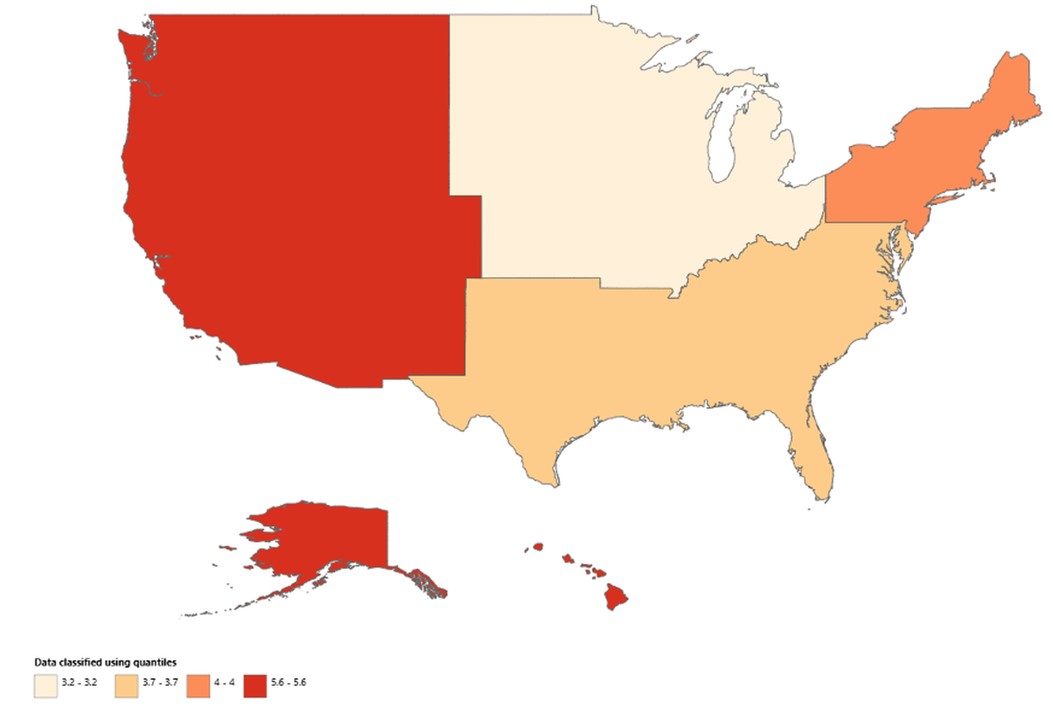
Age-adjusted mortality rates (AAMRs) per 1,000,000 population, with 95% confidence intervals (CIs), were calculated for each calendar year using the direct standardization method with the year-2000 U.S. standard population as the reference [10]. Rates were stratified by sex, race/ethnicity, state, census region, and urban-rural category as applicable. Data were extracted from the CDC WONDER Multiple Cause of Death database (query date: January 24, 2025) for all records listing ICD-10 code C22.0 or K72.9 as any cause of death among decedents aged 25 years or older. National aggregate and sex-stratified analyses used the 1999 – 2023 mortality data; race/ethnicity-, urban-rural-, region-, and state-level analyses used the 1999 – 2020 file. The precise query parameters (ICD-10 codes, age restriction, grouping variables) are available from the corresponding author on request. State- and region-level choropleth maps Figure 5 and Figure 6 display the period-average AAMR across the full 1999 – 2020 observation window, calculated by summing age-group – specific observed and expected death counts across all study years for each geographic unit, and applying direct standardization to the 2000 U.S. standard population.
Temporal trend analysis was performed using the Joinpoint Regression Program (version 5.0.2; National Cancer Institute, Bethesda, MD) [11] to identify statistically significant inflection points within each AAMR series and to derive segment-specific APCs with 95% CIs. The program was configured to allow a maximum of five joinpoints per model series, selected via a grid search with Monte Carlo permutation testing (4,499 permutations). Statistical significance of each segment slope was evaluated at a two-tailed of 0.05; a minimum of four observations per segment was required. Segments were classified as significantly increasing or decreasing only when the associated p-value was below this threshold.
Results
Between 1999 and 2023, the database recorded 22,963 adult deaths (ages 25 – 85+) in which LCC or HF was recorded as an underlying or contributing cause of death, of whom 17,822 (77.6%) were men and 5,141 (22.4%) were women (Supplemental Table 1). Race/ethnicity data (1999 – 2020) identified 2,803 deaths among NH Black individuals, 12,257 among NH Whites, 1,694 among NH Asian or Pacific Islanders, and 2,698 among Hispanic or Latino individuals (Supplemental Table 2). The aggregate AAMR followed a non-linear trajectory: a decline from 1999 to 2007 (APC: -2.4) was succeeded by near-stability from 2007 to 2017 (APC: +0.2), before a renewed and steeper fall from 2017 to 2023 (APC: -3.5) (Supplemental Table 3) and Figure 1.
Gender disparities
Male AAMR followed a non-linear course: an initial reduction from 1999 to 2010 (APC: -2.1) was briefly interrupted by a modest rise from 2010 to 2017 (APC: +0.7), before resuming a more pronounced decline from 2017 to 2023 (APC: -4.4) (Figure 1). Among women, a steeper early decrease from 1999 to 2006 (APC: -3.8) gave way to an essentially stable trajectory through 2023 (APC: -0.1).
Racial disparities
NH Black or African American AAMR declined progressively over the full 1999 – 2020 period (APC: -0.9) (Supplemental Table 4) and Figure 2. Hispanic or Latino populations experienced an initial decrease from 1999 to 2010 (APC: -3.6) followed by a partial rebound through 2020 (APC: +0.6). The NH Asian or Pacific Islander group demonstrated the steepest and most sustained improvement (APC: -6.7 over the entire window). NH White AAMR declined from 1999 to 2006 (APC: -2.6), increased modestly from 2006 to 2018 (APC: +0.5), and then fell sharply from 2018 to 2020 (APC: -7.3).
Urban-rural disparities
Metropolitan AAMR fell steeply between 1999 and 2005 (APC: -3.9) (Supplemental Table 7) and Figure 3, then declined more gradually from 2005 to 2018 (APC: -0.8), before dropping sharply again from 2018 to 2020 (APC: -8.2). Non-metropolitan areas exhibited a sustained upward trend throughout the 1999 – 2020 period (APC: +1.3).
Census region disparities
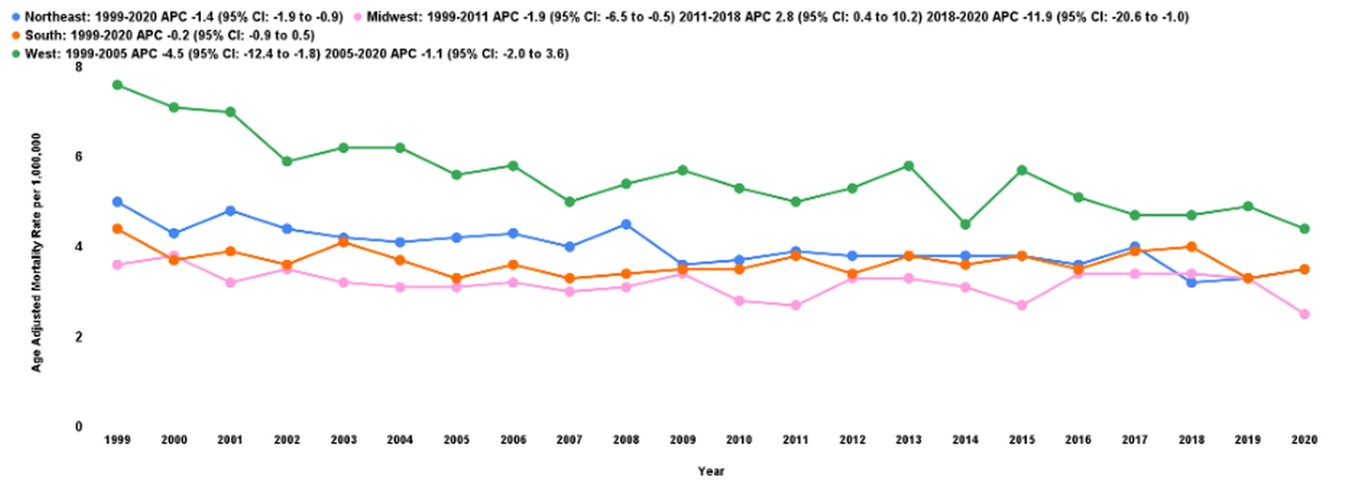
The Northeast showed a uniform downward trend throughout the observation period (APC: -1.4; 95% CI: -1.9 to -0.9). The Midwest declined from 1999 to 2011 (APC: -1.9; 95% CI: -6.5 to -0.5), then reversed from 2011 to 2018 (APC: +2.8; 95% CI: 0.4 to 10.2), before plummeting from 2018 to 2020 (APC: -11.9; 95% CI: -20.6 to -1.0) (Figure 4). The South showed only marginal change overall (APC: -0.2; 95% CI: -0.9 to 0.5). Western states experienced substantial early reductions from 1999 to 2005 (APC: -4.5; 95% CI: -12.4 to -1.8), followed by a leveling off from 2005 to 2020 (APC: -1.1; 95% CI: -2.0 to 3.6).
State disparities
Hawaii recorded the highest state-level AAMR at 10.3 per 1,000,000 (95% CI: 8.9 – 11.6), while Arkansas reported the lowest at 2.4 (95% CI: 2.0 – 2.9) (Supplemental Table 5) and Figure 5. States in the uppermost 90th percentile included Hawaii (10.3), California (6.3), Rhode Island (5.9), Oregon (5.6), and Texas (5.7), all exceeding 5.5 per 1,000,000. At the opposite pole, the lowest 10th percentile comprised Arkansas (2.4), Alabama (2.6), Louisiana (2.6), Mississippi (2.7), and Florida (2.8), reflecting a substantially lower burden of liver disease mortality.
At the regional level, the Northeast and national overall AAMR were nearly identical at 4.0 (95% CI: 3.9 – 4.1) and 4.0 (95% CI: 4.0 – 4.1) per 1,000,000, respectively. The Midwest was somewhat lower (3.2; 95% CI: 3.1 – 3.3), and the South fell between these values (3.7; 95% CI: 3.6 – 3.8). The West substantially exceeded all other regions (5.6; 95% CI: 5.4 – 5.7), representing the highest regional burden of LCC and HF mortality in the country (Supplemental Table 6) and Figure 6.
Discussion
Drawing on 24 years of CDC WONDER mortality surveillance (1999 – 2023), this study characterizes shifting patterns of LCC- and HF-related mortality among U.S. adults aged 25 and older. The overall AAMR trajectory was non-linear: an initial reduction from 1999 to 2007 (APC: -2.4) transitioned to near-stability from 2007 to 2017 (APC: +0.2), before a more rapid decline resumed through 2023 (APC: -3.5). These patterns are consistent with, though cannot be causally attributed to, cumulative improvements in viral hepatitis detection and treatment, broader implementation of liver cancer (including HCC) surveillance protocols, expanded access to systemic therapies including targeted molecular agents and immunotherapy, and growth in liver transplantation programs, all of which have been associated in the literature with reduced liver disease progression [12]. Notably, the final Joinpoint segment (2017 – 2023 overall; 2017 – 2023 for men) represents a relatively short, terminal interval; such segments can be sensitive to end-point effects in Joinpoint regression and should be interpreted with appropriate caution. It must be noted that, as a death certificate – based ecological analysis, this study is descriptive and cannot establish that any specific clinical or public health intervention caused the observed change in trend.
These national trends differ from those reported in earlier U.S. regional analyses, which found rising LCC-attributable AAMR across the general population from 1999 to 2020 [13]. In contrast, contemporaneous analyses from China documented declines in HCC mortality between 2008 and 2017 and between 1999 and 2011 in separate regional cohorts [14,15], with findings attributed to improvements in early detection infrastructure and antiviral treatment uptake. These divergent international patterns underscore the dependence of mortality trajectories on the strength and reach of public health systems; causal inference across ecological analyses from different populations and time periods is not warranted.
Sex-stratified analysis confirmed that men bore a substantially higher LCC and HF mortality burden throughout the study period. While both sexes showed a long-term decline, the male AAMR exhibited greater temporal variation, including a mid-period plateau from 2010 to 2017 before resuming a pronounced terminal decline. In contrast, the female AAMR remained comparatively stable after 2006. These patterns are consistent with the established male predominance in liver cancer and hepatic failure risk; men disproportionately engage in hepatotoxic behaviors including tobacco use, heavy alcohol consumption, and illicit substance use, and are more frequently affected by socioeconomic stressors such as unemployment and income insecurity, all of which have been associated with elevated chronic liver disease risk [12]. Sex-specific differences in the molecular biology and hormonal modulation of hepatocarcinogenesis may also contribute to differential AAMR trajectories between men and women [16]. This analysis cannot determine the degree to which behavioral, biological, or healthcare-access differences drive the observed sex disparity.
In the racial/ethnic analysis (1999 – 2020), NH White individuals had the highest combined LCC and HF mortality, followed by Hispanic or Latino, NH Black, and NH Asian or Pacific Islander populations, with the latter showing the sharpest aggregate decline. These findings warrant nuanced interpretation: Perez et al. documented elevated HCC incidence in Hispanic communities along the U.S. – Mexico border in Texas, attributed to a higher background prevalence of unscreened hepatitis infection, pre-1991 blood transfusion exposure, and alcohol and illicit substance use [17]. White et al. similarly reported elevated age-adjusted HCC incidence among Hispanic Americans nationwide [18], a pattern partly explained by co-occurring hepatitis C viremia, heavy alcohol consumption, metabolic syndrome, type 2 diabetes, and nonalcoholic fatty liver disease [19,20,21]. Race/ethnicity analyses were limited to four groups with adequate non-suppressed data, and the exclusion of other race/ethnicity categories may affect generalizability of the equity conclusions. These descriptive subgroup differences nonetheless underscore the importance of culturally tailored screening programs and targeted preventive strategies in at-risk communities.
Among urbanization strata, non-metropolitan populations experienced a continuous rise in AAMR from 1999 to 2020, while metropolitan populations saw an overall decline, most pronounced after 2018. These patterns may partly reflect the concentration of specialized hepatology and oncology services within major urban centers, which could limit timely access to guideline-concordant care for rural residents [22]. Non-metropolitan communities may also face structural barriers such as lower educational attainment, constrained household incomes, and reduced access to transportation, all of which may delay diagnosis and restrict therapeutic options [23]. Comprehensive rural health strategies that address tobacco cessation, alcohol reduction, obesity prevention, and equitable access to screening represent potential levers to narrow this mortality gap. However, the ecological design of the current study precludes drawing specific causal conclusions. Geographically targeted research is needed to characterize and remediate the observed urban-rural difference in liver disease outcomes.
Regional analysis revealed that the West consistently carried the highest LCC and HF mortality burden, followed by the Northeast, South, and Midwest in descending order. Substantial state- and region-level heterogeneity was evident across 1999 – 2020, with the highest rates disproportionately concentrated in western states [13]. These patterns call for geographically differentiated policy responses; however, because this study cannot account for between-region differences in population age structure, risk-factor prevalence, or healthcare infrastructure, the observed geographic variation should be interpreted descriptively rather than causally.
State-level AAMR varied markedly across the country. Hawaii, California, Texas, Oregon, and Rhode Island clustered in the uppermost 90th percentile, while Arkansas, Alabama, Louisiana, Mississippi, and Florida recorded the lowest rates. Prior analyses have linked elevated liver cancer mortality in states such as Texas, Louisiana, and Alabama to higher regional prevalence of hepatitis C infection, obesity, and alcohol-use disorder [24]. Declining trends in northern and Midwestern states may reflect improved uptake of hepatitis C treatment, enhanced surveillance, and advances in liver disease management [13]. These interstate disparities reinforce the need for state-specific public health programming, though direct causal attribution is beyond the scope of this descriptive surveillance analysis.
Globally, primary liver cancer – of which hepatocellular carcinoma (HCC) constitutes the predominant subtype – ranked as the sixth most commonly diagnosed malignancy and the third leading cause of cancer-related mortality worldwide in 2020 [25]. Sustained reduction of this burden requires investment across multiple domains: universal hepatitis B vaccination, scaled-up direct-acting antiviral therapy for hepatitis C, rigorous blood-product safety protocols, and expanded harm-reduction services. Equally critical are efforts to address the social determinants of liver health, poverty, hazardous substance use, and food insecurity that perpetuate the inequities identified in our analyses. Embedding these preventive and therapeutic strategies within national and regional policy frameworks holds the greatest promise for translating the observed downward trends in mortality into durable, equitable improvements in population liver health.
Limitations
Several limitations must be acknowledged. First, as a death certificate – based ecological analysis, this study cannot establish causality; observed mortality trends may partly reflect changes in coding practices, diagnostic fashions, or ascertainment rather than true biological changes in disease burden. Second, ICD-10 K72.9 captures hepatic failure, unspecified, and does not distinguish between acute and chronic forms; the heterogeneous conditions encompassed by this code limit the specificity of the HF component of our combined endpoint. Third, analyzing LCC and HF as a single combined endpoint precludes independent characterization of trends for each condition in isolation. Fourth, race/ethnicity, urban-rural, region-, and state-level data were constrained to 1999 – 2020 due to public-use file availability, precluding direct comparison with the full 1999 – 2023 national trend; race/ethnicity analyses were further limited to four groups with adequate data, and unknown or other race/ethnicity categories were excluded. Fifth, applying the fixed 2013 NCHS urban-rural classification across the entire 1999 – 2020 series means that counties reclassified over time retain their 2013 designation, potentially distorting apparent urban-rural trends. Sixth, no age-stratified analyses were conducted; given the strong age dependence of liver-related mortality, subgroup comparisons within the broad 25-year age range may be influenced by differences in underlying age structure across demographic groups. Finally, we did not compute direct disparity measures (rate ratios, rate differences, tests of heterogeneity or interaction); the presence of within-stratum APCs does not formally establish that between-stratum differences are statistically significant, and future analyses should incorporate such comparative metrics.
Conflicts of Interest
All authors declare no conflicts of interest.
Funding Source
This research received no specific grant from any funding agency in the public, commercial, or not-for-profit sectors. The authors received no financial support for the research, authorship, or publication of this article.
Acknowledgments
None.
Institutional Review Board (IRB)
This study utilized data from the Centers for Disease Control and Prevention Wide-Ranging Online Data for Epidemiologic Research (CDC WONDER) database, which is publicly available, de-identified, and aggregated. As the data do not involve direct human subjects research and contain no personally identifiable information, institutional review board (IRB) approval was not required.
Large Language Model
Generative AI Use Statement: Generative artificial intelligence (AI) tools (including large language models) were used to assist with language refinement, grammatical editing, and text paraphrasing during the preparation of this manuscript. All content, data, analyses, interpretations, and conclusions were reviewed, verified, and approved by the authors, who take full responsibility for the accuracy and integrity of the manuscript.
Authors Contribution
SMIK contributed to conceptualization, data curation, formal analysis, investigation, methodology, and writing the original draft. MK contributed to data curation, validation, visualization, writing the original draft, and writing review and editing. MHK contributed to data curation, formal analysis, methodology, software, and writing review and editing. SAJ contributed to formal analysis, software, visualization, and writing review and editing. AF contributed to validation, visualization, and writing review and editing. MAM contributed to conceptualization, project administration, supervision, and writing review and editing. MMHK contributed to supervision, validation, and writing review and editing. AQ contributed to conceptualization, methodology, project administration, supervision, and writing review and editing. All authors have read and agreed to the final version of the manuscript.
Data Availability
The data supporting the findings of this study are publicly available through the Centers for Disease Control and Prevention (CDC) Wide-Ranging Online Data for Epidemiologic Research (CDC WONDER) database, accessible at. No proprietary or restricted datasets were used.
References
- Sung H., Ferlay J., Siegel R. L., Laversanne M., Soerjomataram I., Jemal A., Bray F.. Global Cancer Statistics 2020: GLOBOCAN Estimates of Incidence and Mortality Worldwide for 36 Cancers in 185 Countries. CA Cancer J Clin. 2021;71(3):209-249. doi:10.3322/caac.21660 PMID: 33538338
- Stravitz R. T., Lee W. M.. Acute liver failure. Lancet. 2019;394(10201):869-881. doi:10.1016/S0140-6736(19)31894-X PMID: 31498101 PMCID: PMC10836844
- Massarweh N. N., El-Serag H. B.. Epidemiology of Hepatocellular Carcinoma and Intrahepatic Cholangiocarcinoma. Cancer Control. 2017;24(3):1073274817729245. doi:10.1177/1073274817729245 PMID: 28975830 PMCID: PMC5937247
- Villanueva A.. Hepatocellular Carcinoma. N Engl J Med. 2019;380(15):1450-1462. doi:10.1056/NEJMra1713263 PMID: 30970190
- Tapper E. B., Parikh N. D.. Mortality due to cirrhosis and liver cancer in the United States, 1999-2016: observational study. BMJ. 2018;362:k2817. doi:10.1136/bmj.k2817 PMID: 30021785 PMCID: PMC6050518
- Friede A., Reid J. A., Ory H. W.. CDC WONDER: a comprehensive on-line public health information system of the Centers for Disease Control and Prevention. Am J Public Health. 1993;83(9):1289-94. doi:10.2105/ajph.83.9.1289 PMID: 8395776 PMCID: PMC1694976
- Centers for Disease Control and Prevention, National Center for Health Statistics. CDC WONDER Database. Multiple Cause of Death, 1999–2023 [Internet]. 2025.
- von Elm E., Altman D. G., Egger M., Pocock S. J., Gotzsche P. C., Vandenbroucke J. P., STROBE Initiative. The Strengthening the Reporting of Observational Studies in Epidemiology (STROBE) statement: guidelines for reporting observational studies. Ann Intern Med. 2007;147(8):573-7. doi:10.7326/0003-4819-147-8-200710160-00010 PMID: 17938396
- Ingram D. D., Franco S. J.. 2013 NCHS Urban-Rural Classification Scheme for Counties. 2014. PMID: 24776070
- Anderson R. N., Rosenberg H. M.. Age standardization of death rates: implementation of the year 2000 standard. 1998. PMID: 9796247
- National Cancer Institute. Joinpoint Trend Analysis Software, Version 6.0.1 [Computer software]. 2024.
- Wang F., Mubarik S., Zhang Y., Wang L., Wang Y., Yu C., Li H.. Long-Term Trends of Liver Cancer Incidence and Mortality in China 1990-2017: A Joinpoint and Age-Period-Cohort Analysis. Int J Environ Res Public Health. 2019;16(16). doi:10.3390/ijerph16162878 PMID: 31408961 PMCID: PMC6719938
- Doddi S., Salichs O., Hibshman T., Bhargava P.. Trends of liver cell carcinoma mortality in the United States by demographics and geography. Curr Probl Diagn Radiol. 2024;53(2):208-214. doi:10.1067/j.cpradiol.2023.10.007 PMID: 37891079
- Liu C., Wu J., Chang Z.. Trends and Age-Period-Cohort Effects on the Prevalence, Incidence and Mortality of Hepatocellular Carcinoma from 2008 to 2017 in Tianjin, China. Int J Environ Res Public Health. 2021;18(11). doi:10.3390/ijerph18116034 PMID: 34199687 PMCID: PMC8200005
- Xiao J., Huang J., Zhang M., Zhu J., Wu G., Gao Y.. [Trends and forecast of hepatocellular carcinoma in Nantong, China: mortality rates from 1999 to 2011]. Zhonghua Gan Zang Bing Za Zhi. 2015;23(9):663-8. doi:10.3760/cma.j.issn.1007-3418.2015.09.006 PMID: 26524359 PMCID: PMC12814474
- Li Y., Xu A., Jia S., Huang J.. Recent advances in the molecular mechanism of sex disparity in hepatocellular carcinoma. Oncol Lett. 2019;17(5):4222-4228. doi:10.3892/ol.2019.10127 PMID: 30988804 PMCID: PMC6447942
- Perez A., Anzaldua M., McCormick J., Fisher-Hoch S.. High frequency of chronic end-stage liver disease and hepatocellular carcinoma in a Hispanic population. J Gastroenterol Hepatol. 2004;19(3):289-95. doi:10.1111/j.1440-1746.2003.03277.x PMID: 14748876
- White D. L., Thrift A. P., Kanwal F., Davila J., El-Serag H. B.. Incidence of Hepatocellular Carcinoma in All 50 United States, From 2000 Through 2012. Gastroenterology. 2017;152(4):812-820 e5. doi:10.1053/j.gastro.2016.11.020 PMID: 27889576 PMCID: PMC5346030
- Kallwitz E. R., Daviglus M. L., Allison M. A., Emory K. T., Zhao L., Kuniholm M. H., Chen J., Gouskova N., Pirzada A., Talavera G. A., Youngblood M. E., Cotler S. J.. Prevalence of suspected nonalcoholic fatty liver disease in Hispanic/Latino individuals differs by heritage. Clin Gastroenterol Hepatol. 2015;13(3):569-76. doi:10.1016/j.cgh.2014.08.037 PMID: 25218670 PMCID: PMC4333050
- Mittal S., Sada Y. H., El-Serag H. B., Kanwal F., Duan Z., Temple S., May S. B., Kramer J. R., Richardson P. A., Davila J. A.. Temporal trends of nonalcoholic fatty liver disease-related hepatocellular carcinoma in the veteran affairs population. Clin Gastroenterol Hepatol. 2015;13(3):594-601 e1. doi:10.1016/j.cgh.2014.08.013 PMID: 25148760 PMCID: PMC4333060
- Setiawan V. W., Wei P. C., Hernandez B. Y., Lu S. C., Monroe K. R., Le Marchand L., Yuan J. M.. Disparity in liver cancer incidence and chronic liver disease mortality by nativity in Hispanics: The Multiethnic Cohort. Cancer. 2016;122(9):1444-52. doi:10.1002/cncr.29922 PMID: 26916271 PMCID: PMC4840042
- Singh G. K., Siahpush M.. Widening rural-urban disparities in all-cause mortality and mortality from major causes of death in the USA, 1969-2009. J Urban Health. 2014;91(2):272-92. doi:10.1007/s11524-013-9847-2 PMID: 24366854 PMCID: PMC3978153
- Endeshaw M., Hallowell B. D., Razzaghi H., Senkomago V., McKenna M. T., Saraiya M.. Trends in liver cancer mortality in the United States: Dual burden among foreign- and US-born persons. Cancer. 2019;125(5):726-734. doi:10.1002/cncr.31869 PMID: 30480828 PMCID: PMC6681907
- Endeshaw M., Hallowell B. D., Razzaghi H., Senkomago V., McKenna M. T., Saraiya M.. Trends in liver cancer mortality in the United States: Dual burden among foreign- and US-born persons. Cancer. 2019;125(5):726-734. doi:10.1002/cncr.31869 PMID: 30480828 PMCID: PMC6681907
- Bray F., Laversanne M., Sung H., Ferlay J., Siegel R. L., Soerjomataram I., Jemal A.. Global cancer statistics 2022: GLOBOCAN estimates of incidence and mortality worldwide for 36 cancers in 185 countries. CA Cancer J Clin. 2024;74(3):229-263. doi:10.3322/caac.21834 PMID: 38572751
References
Sung H, Ferlay J, Siegel RL, Laversanne M, Soerjomataram I, Jemal A, Bray F. Global Cancer Statistics 2020: GLOBOCAN Estimates of Incidence and Mortality Worldwide for 36 Cancers in 185 Countries. CA Cancer J Clin. 2021;71(3):209-49. [PMID: 33538338, https://doi.org/10.3322/caac.21660].
Stravitz RT, Lee WM. Acute liver failure. Lancet. 2019;394(10201):869-81. [PMID: 31498101, PMCID: PMC10836844, https://doi.org/10.1016/S0140-6736(19)31894-X].
Massarweh NN, El-Serag HB. Epidemiology of Hepatocellular Carcinoma and Intrahepatic Cholangiocarcinoma. Cancer Control. 2017;24(3):1073274817729245. [PMID: 28975830, PMCID: PMC5937247, https://doi.org/10.1177/1073274817729245].
Villanueva A. Hepatocellular Carcinoma. N Engl J Med. 2019;380(15):1450-62. [PMID: 30970190, https://doi.org/10.1056/NEJMra1713263].
Tapper EB, Parikh ND. Mortality due to cirrhosis and liver cancer in the United States, 1999-2016: observational study. BMJ. 2018;362:k2817. [PMID: 30021785, PMCID: PMC6050518, https://doi.org/10.1136/bmj.k2817].
Friede A, Reid JA, Ory HW. CDC WONDER: a comprehensive on-line public health information system of the Centers for Disease Control and Prevention. Am J Public Health. 1993;83(9):1289-94. [PMID: 8395776, PMCID: PMC1694976, https://doi.org/10.2105/ajph.83.9.1289].
Centers for Disease Control and Prevention, National Center for Health Statistics. CDC WONDER Database. Multiple Cause of Death, 1999–2023 [Internet]; 2025. Available from: https://wonder.cdc.gov/mcd-icd10-expanded.html. Accessed January 24, 2025.
von Elm E, Altman DG, Egger M, Pocock SJ, Gotzsche PC, Vandenbroucke JP, Initiative S. The Strengthening the Reporting of Observational Studies in Epidemiology (STROBE) statement: guidelines for reporting observational studies. Ann Intern Med. 2007;147(8):573-7. [PMID: 17938396, https://doi.org/10.7326/0003-4819-147-8-200710160-00010].
Ingram DD, Franco SJ. 2013 NCHS Urban-Rural Classification Scheme for Counties. 2014. Vital Health Stat 2. 2014 Apr;(166):1-73. [PMID: 24776070].
Anderson RN, Rosenberg HM. Age standardization of death rates: implementation of the year 2000 standard; 1998. Natl Vital Stat Rep. 1998 Oct 7;47(3):1-16, 20. [PMID: 9796247].
National Cancer Institute. Joinpoint Trend Analysis Software, Version 6.0.1 [Computer software]; 2024. Bethesda, MD: Surveillance Research Program, National Cancer Institute. Available from: https://www.cancer.gov.
Wang F, Mubarik S, Zhang Y, Wang L, Wang Y, Yu C, Li H. Long-Term Trends of Liver Cancer Incidence and Mortality in China 1990-2017: A Joinpoint and Age-Period-Cohort Analysis. Int J Environ Res Public Health. 2019;16(16). [PMID: 31408961, PMCID: PMC6719938, https://doi.org/10.3390/ijerph16162878].
Doddi S, Salichs O, Hibshman T, Bhargava P. Trends of liver cell carcinoma mortality in the United States by demographics and geography. Curr Probl Diagn Radiol. 2024;53(2):208-14. [PMID: 37891079, https://doi.org/10.1067/j.cpradiol.2023.10.007].
Liu C, Wu J, Chang Z. Trends and Age-Period-Cohort Effects on the Prevalence, Incidence and Mortality of Hepatocellular Carcinoma from 2008 to 2017 in Tianjin, China. Int J Environ Res Public Health. 2021;18(11). [PMID: 34199687, PMCID: PMC8200005, https://doi.org/10.3390/ijerph18116034].
Xiao J, Huang J, Zhang M, Zhu J, Wu G, Gao Y. [Trends and forecast of hepatocellular carcinoma in Nantong, China: mortality rates from 1999 to 2011]. Zhonghua Gan Zang Bing Za Zhi. 2015;23(9):663-8. [PMID: 26524359, PMCID: PMC12814474, https://doi.org/10.3760/cma.j.issn.1007-3418.2015.09.006].
Li Y, Xu A, Jia S, Huang J. Recent advances in the molecular mechanism of sex disparity in hepatocellular carcinoma. Oncol Lett. 2019;17(5):4222-8. [PMID: 30988804, PMCID: PMC6447942, https://doi.org/10.3892/ol.2019.10127].
Perez A, Anzaldua M, McCormick J, Fisher-Hoch S. High frequency of chronic end-stage liver disease and hepatocellular carcinoma in a Hispanic population. J Gastroenterol Hepatol. 2004;19(3):289-95. [PMID: 14748876, https://doi.org/10.1111/j.1440-1746.2003.03277.x].
White DL, Thrift AP, Kanwal F, Davila J, El-Serag HB. Incidence of Hepatocellular Carcinoma in All 50 United States, From 2000 Through 2012. Gastroenterology. 2017;152(4):812-20 e5. [PMID: 27889576, PMCID: PMC5346030, https://doi.org/10.1053/j.gastro.2016.11.020].
Kallwitz ER, Daviglus ML, Allison MA, Emory KT, Zhao L, Kuniholm MH, Chen J, Gouskova N, Pirzada A, Talavera GA, Youngblood ME, Cotler SJ. Prevalence of suspected nonalcoholic fatty liver disease in Hispanic/Latino individuals differs by heritage. Clin Gastroenterol Hepatol. 2015;13(3):569-76. [PMID: 25218670, PMCID: PMC4333050, https://doi.org/10.1016/j.cgh.2014.08.037].
Mittal S, Sada YH, El-Serag HB, Kanwal F, Duan Z, Temple S, May SB, Kramer JR, Richardson PA, Davila JA. Temporal trends of nonalcoholic fatty liver disease-related hepatocellular carcinoma in the veteran affairs population. Clin Gastroenterol Hepatol. 2015;13(3):594-601 e1. [PMID: 25148760, PMCID: PMC4333060, https://doi.org/10.1016/j.cgh.2014.08.013].
Setiawan VW, Wei PC, Hernandez BY, Lu SC, Monroe KR, Le Marchand L, Yuan JM. Disparity in liver cancer incidence and chronic liver disease mortality by nativity in Hispanics: The Multiethnic Cohort. Cancer. 2016;122(9):1444-52. [PMID: 26916271, PMCID: PMC4840042, https://doi.org/10.1002/cncr.29922].
Singh GK, Siahpush M. Widening rural-urban disparities in all-cause mortality and mortality from major causes of death in the USA, 1969-2009. J Urban Health. 2014;91(2):272-92. [PMID: 24366854, PMCID: PMC3978153, https://doi.org/10.1007/s11524-013-9847-2].
Endeshaw M, Hallowell BD, Razzaghi H, Senkomago V, McKenna MT, Saraiya M. Trends in liver cancer mortality in the United States: Dual burden among foreign- and US-born persons. Cancer. 2019;125(5):726-34. [PMID: 30480828, PMCID: PMC6681907, https://doi.org/10.1002/cncr.31869].
Endeshaw M, Hallowell BD, Razzaghi H, Senkomago V, McKenna MT, Saraiya M. Trends in liver cancer mortality in the United States: Dual burden among foreign- and US-born persons. Cancer. 2019;125(5):726-34. [PMID: 30480828, PMCID: PMC6681907, https://doi.org/10.1002/cncr.31869].
Bray F, Laversanne M, Sung H, Ferlay J, Siegel RL, Soerjomataram I, Jemal A. Global cancer statistics 2022: GLOBOCAN estimates of incidence and mortality worldwide for 36 cancers in 185 countries. CA Cancer J Clin. 2024;74(3):229-63. [PMID: 38572751, https://doi.org/10.3322/caac.21834].
Data Availability Statement
The data supporting the findings of this study are publicly available through the Centers for Disease Control and Prevention (CDC) Wide-Ranging Online Data for Epidemiologic Research (CDC WONDER) database, accessible at https://wonder.cdc.gov/. No proprietary or restricted datasets were used.
License
Copyright (c) 2026 Sardar Muhammad Imran Khan, Muneeb Khawar, Muhammad Haris Khan, Salman Ayub Jajja, Ayesha Fatima, Mohammad Azeem Malik, Mirza Muhammad Hadeed Khawar, Abdul Qadeer

This work is licensed under a Creative Commons Attribution 4.0 International License.
Copyright and Licensing
All articles published in ASIDE Gastroenterology are open access and freely available online immediately upon publication, without embargo.
This journal applies the terms of the Creative Commons Attribution 4.0 International License (CC BY 4.0). Under this license, anyone may copy, redistribute, remix, transform, and build upon the material for any purpose, even commercially, provided that proper credit is given to the original author(s), a link to the license is provided, and any changes made are indicated.
-
License link: https://creativecommons.org/licenses/by/4.0/
-
Machine-readable license metadata is embedded in each article and its DOI record.
Copyright Holder
Copyright in all articles remains with the author(s). ASIDE Gastroenterology is published and owned by PubPorta Publishing LLC. By submitting a manuscript, authors agree to grant the publisher a non-exclusive license to publish, distribute, archive, and identify itself as the original publisher of the work under the terms of the CC BY 4.0 license.
Academic oversight and scholarly guidance are provided by the American Society for Inclusion, Diversity, and Equity in Healthcare (ASIDE). Copyright and licensing arrangements are administered by the publisher.
Third-party Material
Any material (e.g., images, figures, or tables) not covered by CC BY 4.0 will be clearly indicated in the article. Users must obtain permission directly from the copyright holder for reuse of such third-party material.
Author Rights and Self-Archiving
Authors are permitted to deposit all versions of their work (preprint, author’s accepted manuscript, and version of record) in institutional or subject repositories of their choice immediately upon publication, without embargo, provided that the DOI and license information are included.

Published
Issue
Section
How to Cite
Article history
- Received
- 5 Apr 2026
- Received in revised form
- 7 Jun 2026
- Accepted
- 19 Jun 2026
- Published
- 27 Jul 2026