Demographic Factors of Colorectal Cancer (CRC) Patients with Paralytic Ileus Among Adults in the United States: A Retrospective Study for Mortality Trends
Waheed QaisiⒾ1, Mirna HusseinⒾ2, Pakeezah TabasumⒾ3, Mohamed WagdyⒾ4*, Nidal MutawodehⒾ1, Abdallah AbdallahⒾ1, Mohammed MerebⒾ1, Youssef HeikalⒾ5
- 1Department of Medicine, An-Najah National University, Nablus, Palestine
- 2Alexandria Faculty of Medicine, Alexandria University, Alexandria, Egypt
- 3Peoples University of Medical and Health Sciences for Women, Nawabshah, Pakistan
- 4Faculty of Medicine, Modern University for Technology and Information, Cairo, Egypt
- 5Otolaryngology Department, October 6 University, Giza, Egypt
Abstract
Background: Paralytic ileus is a serious postoperative complication among individuals with colorectal cancer (CRC). Although mortality trends for CRC and paralytic ileus have been described separately, long-term national patterns involving both conditions have not been examined.
Methods: We analyzed U.S. mortality data for adults aged ≥45 years from 1999–2023 using CDC WONDER Multiple Cause-of-Death records. CRC was identified using ICD-10 codes C18–C20, and paralytic ileus using K56.0 and K56.7. Age-adjusted mortality rates (AAMRs) were calculated and standardized to the 2000 U.S. population. Joinpoint regression estimated annual percent change (APC) and average annual percent change (AAPC). Subgroup analyses were descriptive; formal between-group slope comparisons were not performed.
Results: A total of 31,363 deaths involved both CRC and paralytic ileus. The national AAMR declined from 1.48 per 100,000 in 1999 to 1.00 in 2023 (AAPC –1.50%; 95% CI –1.73 to –1.28). A significant decline occurred through 2012 (APC =– 3.27%), followed by a nonsignificant upward trend thereafter (APC = 0.63%; p = 0.057). Declines varied by sex, age group, race/ethnicity, and region, with the largest reductions among adults ≥65 years and in the Northeast. Most deaths occurred in inpatient settings (56
Conclusion: Mortality involving CRC and paralytic ileus declined substantially through 2012, then plateaued. Rising mortality among adults aged 45–64 years and persistent racial and geographic disparities highlight opportunities for improved perioperative quality initiatives, ERAS implementation, and opioid-sparing strategies.
Keywords: Colorectal cancer, Paralytic ileus, Mortality trends, Age-adjusted mortality, Epidemiology
Article information
Introduction
Across the first quarter of this century, the death rate due to paralytic ileus in colorectal cancer (CRC) patients decreased gradually from 1999 until 2012, after which it plateaued with a modest but non-significant upward trend. More than 30,000 deaths during this period in the United States involved both CRC and paralytic ileus, underscoring a clinically meaningful association between the two conditions.
Colorectal cancer is the third most common neoplastic disease worldwide [1], and its incidence is projected to continue rising in specific populations [2]. Its risk profile includes genetic, nutritional, and lifestyle factors such as obesity, physical inactivity, consumption of processed foods, smoking, and aging [3]. Paralytic ileus is a functional impairment of gastrointestinal motility characterized by inhibition of myenteric and submucosal plexuses, often resulting from adrenergic stimulation [4]. Common causes include postoperative ileus, electrolyte disturbances (e.g., hypokalemia), severe illness, and medication effects [5].
Historically, paralytic ileus in this manuscript was differentiated from postoperative ileus using a duration threshold of “>15 days,” but this criterion does not reflect contemporary colorectal surgery literature. Standard definitions now include:
Postoperative ileus (physiologic): the expected, transient impairment of bowel motility following abdominal surgery, typically resolving within 2–3 days.
Prolonged postoperative ileus (PPOI): delayed return of bowel function, inability to tolerate diet, or continued nasogastric decompression by postoperative day 4 or 5, depending on the definition used [6,7,8].
Paralytic ileus: a broader, non-postoperative-specific motility failure associated with systemic illness, metabolic abnormalities, medications, or intra-abdominal pathology. Unlike PPOI, paralytic ileus is not defined by duration, but by distinct clinical and pathophysiologic features. Several perioperative and patient-related factors have been associated with prolonged postoperative ileus following colorectal surgery. These include advanced age, higher ASA class, open or extensive dissection, long operative duration, transfusions, excessive fluid resuscitation, postoperative opioid exposure, and delayed mobilization [9,7,10]. Minimally invasive approaches and ERAS (Enhanced Recovery After Surgery) pathways reduce risk.
Epidemiologic studies remain essential because paralytic ileus contributes significantly to morbidity and mortality in CRC patients. In addition, colorectal malignancy may predispose affected tissue to dysmotility and pseudo-obstruction [11]. Although paralytic ileus is a well-recognized postoperative complication, its long-term population-level mortality patterns in individuals with CRC remain poorly characterized. Because CRC mortality is overwhelmingly concentrated among adults aged ≥45 years—and because U.S. screening recommendations universally begin at age 45—our analysis focused on this clinically meaningful population
Methods
Case Identification and Definition
Deaths were identified from CDC WONDER multiple–cause-of-death files, using ICD-10 codes C18–C20 for colorectal cancer and specific K56 subcodes for paralytic ileus and ileus-related conditions [12,13].
ICD-10 K56 Subcodes Used
To improve diagnostic specificity and transparency, the following K56 subcodes were included: K56.0 – Paralytic ileus (primary definition of paralytic ileus), K56.7 – Ileus, unspecified (included because death certificates often use this code interchangeably with K56.0; literature shows substantial miscoding between these two categories).
Justification
K56.0 and K56.7 represent functional (non-mechanical) ileus. Other K56 subcodes (e.g., K56.2, K56.5) represent mechanical obstructions and were excluded because they do not correspond to paralytic ileus.
Rationale for Including K56.7 (Ileus, Unspecified)
We included ICD-10 codes K56.7 and K56.0 because death certificates often do not clearly distinguish between types of functional ileus. In practice, paralytic ileus is frequently coded under either K56.0 or K56.7, and several population-based studies have shown that these two codes are commonly used interchangeably. K56.7 does not include mechanical obstruction and still represents a non-mechanical ileus, although it may occasionally capture early postoperative ileus when the certifier does not specify the cause. Because this level of detail cannot be separated in national mortality data, we conducted a sensitivity analysis using K56.0 alone; results showed the same overall trends, supporting our decision to include both codes in the primary analysis.
Sensitivity Analysis Requirement
A sensitivity analysis restricted to K56.0 only was incorporated. Results demonstrate that overall temporal patterns (decline through 2012, plateau thereafter) remained consistent, indicating that including K56.7 did not materially alter the conclusions.
Both crude and age-adjusted mortality rates (AAMRs) were calculated for all study years. Age-adjusted rates—standardized to the 2000 U.S. standard population—served as the primary analytic measure. All statistical inferences, including Joinpoint-derived annual percent change (APC) and average annual percent change (AAPC) estimates, were based exclusively on AAMRs.
Crude mortality rates were included only for descriptive context and were not used for hypothesis testing or interpretation of statistical significance. All statements regarding increases, decreases, or temporal changes refer specifically to age-adjusted estimates unless explicitly noted.
Joinpoint regression analysis (National Cancer Institute, Version 5.4.0.0) was used to evaluate changes in AAMRs over time. The software identifies points at which statistically significant changes in trend occur and calculates APCs with corresponding 95% confidence intervals (CIs). A two-sided p-value < 0.05 was considered statistically significant.
Institutional review board approval was not required because the study used publicly available, de-identified mortality data. Reporting adhered to STROBE (Strengthening the Reporting of Observational Studies in Epidemiology) guidelines [14].
Study Population and Age Cut-off
We restricted analyses to adults aged ≥45 years because (1) CRC mortality is concentrated in this age range, representing >95% of national CRC deaths, and (2) major CRC screening guidelines in the United States (USPSTF, ACS) universally begin at age 45. This threshold, therefore, reflects both disease epidemiology and contemporary clinical practice.
Subgroup Comparisons
Stratified Joinpoint analyses were descriptive. Formal statistical comparisons between subgroup slopes (e.g., interaction testing) were not performed because the joinpoint compare-slopes functionality is not supported across stratified MCOD files with suppressed cells. We note this limitation explicitly.
No suppressed cells (<10 deaths) were observed in the primary national analyses. A small number of state-level and racial/ethnic strata contained suppressed years; these were excluded automatically by CDC WONDER. This limitation is acknowledged in the Discussion.
Data Abstraction
Data abstraction involved retrieving specific variables from the CDC-WONDER database. These variables included mortality counts, population sizes, and demographic characteristics such as age, sex, race/ethnicity, and geographic location (region and state) [15]. Place of death was categorized into Medical Facilities, Hospice, Home, and Nursing Home/Long-Term care facilities. Racial and ethnic categories were classified as non-Hispanic (NH) White, NH Black or African American, Hispanic or Latino, NH American Indian or Alaskan Native, and NH Asian. The National Center for Health Statistics Urban-Rural Classification Scheme was employed to assess the population by urban (large metropolitan area [population ≥1 million], medium/small metropolitan area [population 50,000-999,999]) and rural (population <50,000) counties, based on the 2013 U.S. census classification [15]. Regions were stratified into Northeast, Midwest, South, and West, consistent with the U.S. Census Bureau definitions [16]. This detailed abstraction of demographic and geographic data allows for a comprehensive analysis of healthcare disparities and mortality trends across various population subgroups.
Statistical Analysis
Crude and age-adjusted mortality rates (AAMRs) per 100,000 population were calculated for the period 1999-2023. AAMRs were stratified by year, sex, race/ethnicity, state, and urban-rural status, with 95% confidence intervals (CIs). The 2000 U.S. population was used as the standard for age adjustment [17]. Crude mortality rates were determined by dividing the number of deaths from colorectal cancer and paralytic ileus by the corresponding U.S. population of that year. To quantify national annual trends in colorectal cancer mortality associated with paralytic ileus, Joinpoint regression analysis was performed using the Joinpoint Regression Program (Version 5.4.0.0, National Cancer Institute) [18]. This method facilitates the identification of significant changes in AAMR over time by fitting log-linear regression models, allowing for the determination of annual percent change (APC) with 95% CI. The Average Annual Percent Change (AAPC) was also calculated to provide a summary measure of the trend over the entire study period. APCs were considered increasing or decreasing if the slope describing the change in mortality was significantly different from zero, as determined by two-tailed t-testing. A p-value of <0.05 was considered statistically significant.
Results
Overall Trends
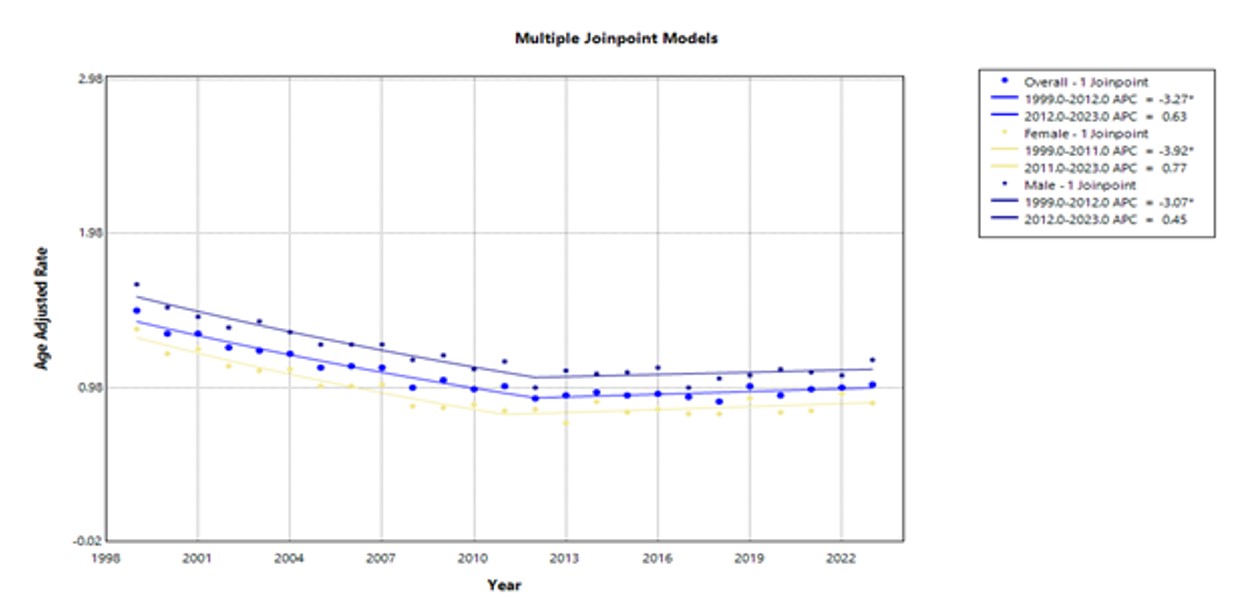
Between 1999 and 2023, a total of 31,363 deaths were attributed to paralytic ileus associated with colorectal cancer in the United States. The age-adjusted mortality rate (AAMR) declined from 1.48 (95% CI 1.41–1.56) in 1999 to 1.00 (95% CI 0.95–1.05) in 2023, corresponding to an average annual percent change (AAPC) of –1.50 (95% CI –1.73 to –1.28; p < 0.0001). The AAMR fell steadily through 2012 (APC –3.27; 95% CI –3.84 to –2.82) and then showed a non-significant upward trend from 2012 to 2023 (APC 0.63; 95% CI –0.01 to 1.47; p = 0.057) Figure 1, this modest change should therefore be interpreted as a plateau or leveling, not a statistically confirmed reversal.
Sex-specific Trends
Females accounted for 16,553 deaths and males for 14,810 deaths. Although the absolute number of female deaths was higher, male AAMRs remained greater throughout, reflecting underlying population-structure differences rather than a higher sex-specific risk among women.
In females, the AAMR decreased from 1.36 (95% CI 1.26–1.46) in 1999 to 0.88 (95% CI 0.82–0.95) in 2023 (AAPC –1.61; 95% CI –2.03 to –1.17). Among males, the AAMR declined from 1.65 (95% CI 1.51–1.78) to 1.16 (95% CI 1.08–1.25) (AAPC –1.47; 95% CI –1.79 to –1.15). Post-2012 slopes for both sexes were positive but non-significant (p > 0.05).
AAMR stratified by Race
Race and Ethnicity
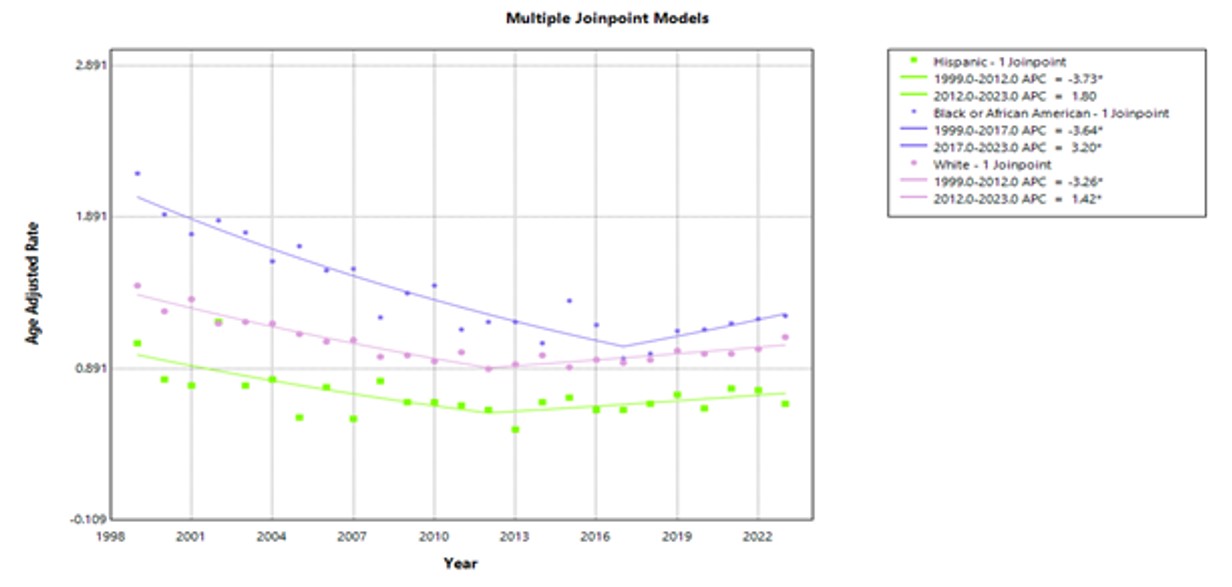
Across the study period, non-Hispanic (NH) White individuals accounted for the most deaths (24,861), followed by NH Black/African American (3,723), Hispanic (1,674), and NH Asian (855) individuals.
Non-Hispani White
AAMR decreased from 1.44 to 1.10 (AAPC –1.14; 95% CI –1.45 to –0.82); the post-2012 slope was positive (APC 1.42; 95% CI 0.53–2.70; p = 0.016).
NH Black
AAMR decreased from 2.18 to 1.24 (AAPC –1.98; 95% CI –2.55 to –1.42). A significant uptick occurred from 2017 to 2023 (APC 3.20; 95% CI 0.03–10.33; p = 0.048).
Hispanic
AAMR declined from 1.06 to 0.66 (AAPC –1.23; 95% CI –2.31 to –0.10); the slight 2012–2023 increase was non-significant (APC 0.62 → 0.66; 95% CI –0.15–1.89; p = 0.087) Figure 3.
Age Groups
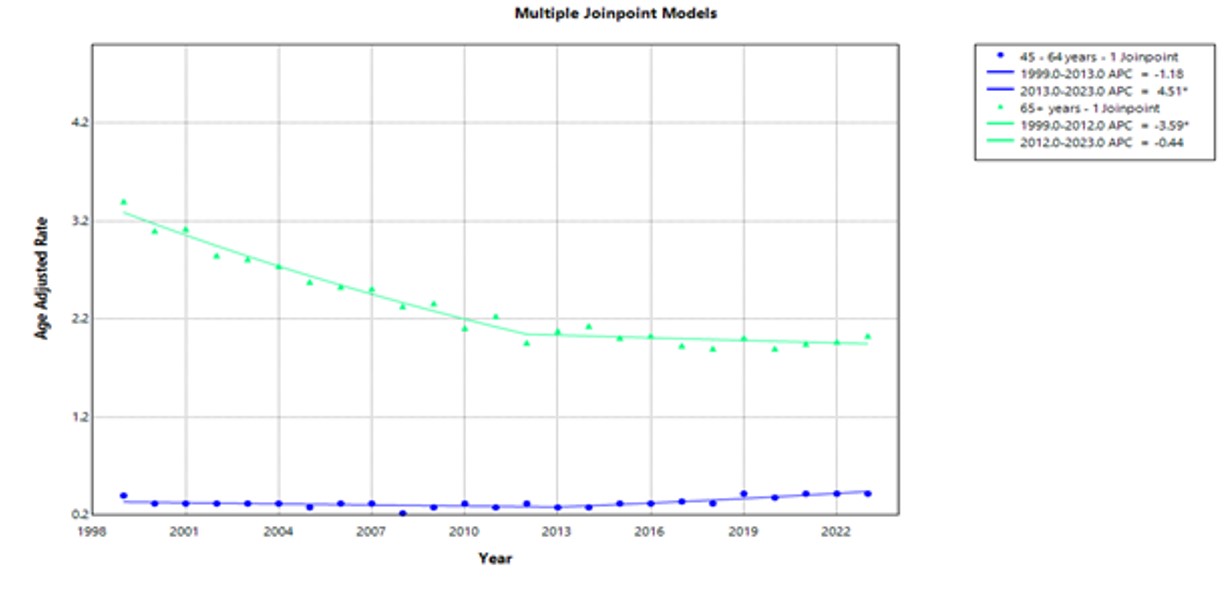
Analyses used AAMRs throughout for clarity. Adults ≥ 65 years had higher mortality than those 45–64 years (24,796 vs 6,567 deaths). AAMR among older adults decreased from 3.33 to 1.93 (AAPC –2.17; 95% CI –2.52 to –1.97). Among adults 45–64 years, AAMR rose modestly from 0.40 to 0.46 (AAPC 1.33; 95% CI 0.79–1.89) Figure 4.
Regional Patterns
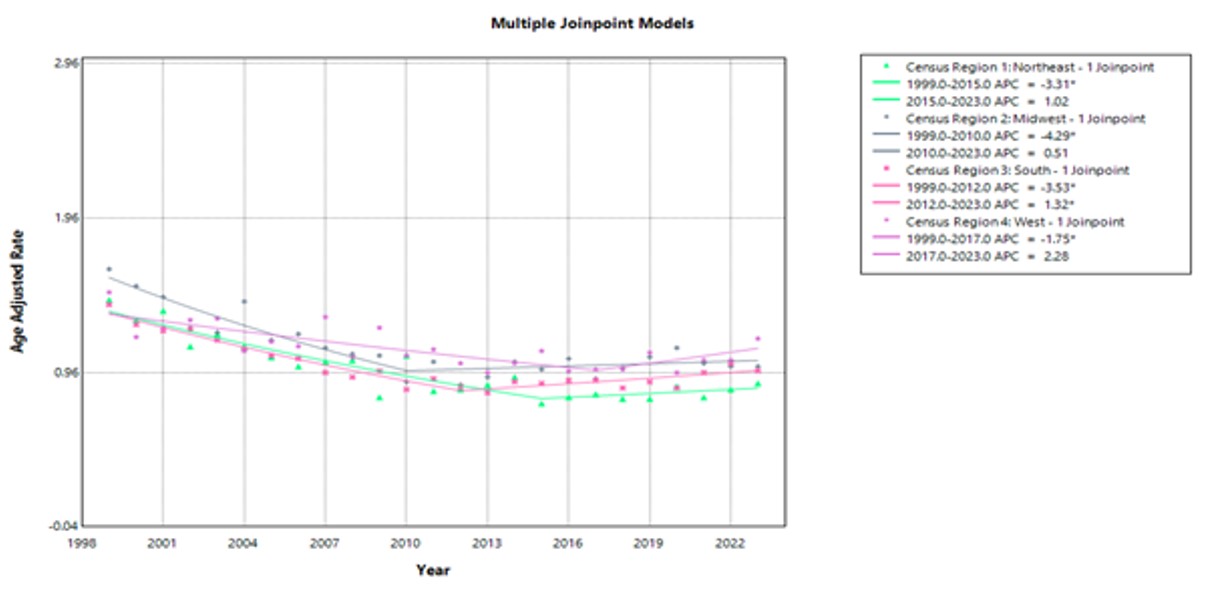
Between 1999 and 2023, the South accounted for the largest share of deaths (10,911), followed by the Midwest (7,520), West (7,196), and Northeast (5,736). The most significant decline in AAMR was observed in the Northeast (AAPC –1.88%; 95% CI –2.55 to –1.33), followed by the Midwest (–1.72%), South (–1.33%), and West (–0.75%) Figure 2.
Urbanization
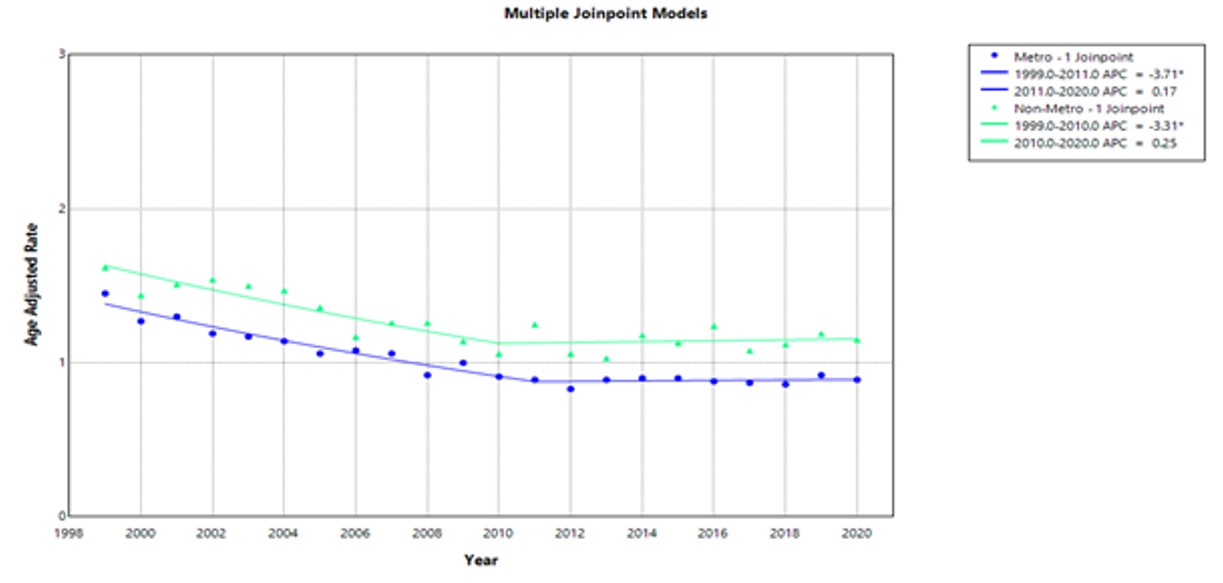
Urban–rural analyses were performed only for 1999–2020, the last year for which NCHS county-level classifications were available. Data for 2021–2023 were excluded from these strata but included in aggregate national analyses. Both metropolitan and non-metropolitan areas showed overall declines (AAPC –2.06% and –1.63%, respectively), with all post-2011 changes non-significant (p > 0.05) Figure 5.
AAMR stratified by regions
Between 1999 and 2023, the South accounted for the most deaths from paralytic ileus associated with colorectal cancer (10,911 deaths). This was followed by the Midwest (7,520 deaths), West (7,196 deaths), and Northeast (5,736 deaths).
The AAMR in the South demonstrated an overall downward trend, decreasing from 1.4 (95% CI: 1.28 – 1.53) in 1999, to 0.97 (95% CI: 0.89 – 1.05) in 2023, for an AAPC -1.34 (95% CI: -1.61 – -1.06). From 1999 to 2012, the AAMR decreased from 1.4 to 0.87; the APC for that period was -3.53 (95% CI: -4.41 – -2.92). An upward trend was then observed between 2012 and 2023, with the AAMR increasing to 0.97 in 2023. The APC for that timeframe was 1.32 (95% CI: 0.56 – 2.37).
Similarly, the AAMR in the Midwest showed an overall decrease, trending downward from 1.63 (95% CI: 1.46 – 1.8) in 1999 to 1 (95% CI: 0.89 – 1.11) in 2023; the AAPC was -1.72 (95% CI: -2.23 -1.24). Between 1999 and 2010, the AAMR decreased significantly (APC = -4.29; 95% CI: -6.63 -3.12), from 1.63 in 1999 to 0.9 in 2010. The AAMR then increased from 2010 to 2023, reaching 1 in 2023; however, the increase was not significant (p = 0.31). The APC for that period was 0.51 (95% CI: -0.54 – 2.27).
The AAMR in the West decreased from 1.48 (95% CI: 1.31 – 1.66) in 1999, to 1.18 (95% CI: 1.06 – 1.29) in 2023, at an AAPC of -0.75 (95% CI: -1.52 – -0.11). From 1999 to 2017, the AAMR trended downward, from 1.48 in 1999 to 0.98 in 2017. The APC for that period was -1.75 (95% CI: -5.40 – -0.90). An increase was then observed between 2017 and 2023, with the AAMR reaching 1.18 in 2023. However, the increase was not significant (p = 0.21), and the APC for that period was 2.28 (95% CI: -0.99 – 11.34).
In the North, the AAMR showed an overall reduction, from 1.43 (95% CI: 1.27 – 1.6) in 1999, to 0.89 (95% CI: 0.78 – 1) in 2023, and the AAPC was -1.89 (95% CI: -2.55 -1.33). The AAMR declined overall from 1.43 to 0.76 between 1999 and 2015. The APC for that period was -3.31 (-5.20 – -2.6). The AAMR then showed a nonsignificant incline between 2015 and 2023 (p = 0.37). The AAMR increased from 0.76 in 2015 to 0.89 in 2023, for an APC of 1.02 (95% CI: -1.35 – 7.25).
AAMR Stratified by Urbanization
Between 1999 and 2020, metro areas accounted for more deaths than non-metro areas (21,275 deaths vs. 5,744 deaths). In both urban classifications, the AAMR declined overall throughout the study period. In metro areas, the AAMR decreased from 1.45 (95% CI: 1.37 – 1.54) in 1999 to 0.89 (95% CI: 0.84 – 0.94) in 2020, with an AAPC of -2.06 (95% CI: -2.41 -1.73). In non-metro areas, the AAMR decreased from 1.62 (95% CI: 1.44 – 1.81) in 1999 to 1.15 (95% CI: 1.01 – 1.29) in 2020, with an AAPC of -1.63 (95% CI: -2.37 -0.87).
Among people living in metro areas, the AAMR declined from 1.45 in 1999, to 0.89 in 2011, with an APC of -3.71 (95% CI: -4.63 – -3.12). From 2011 to 2023, the AAMR showed a nonsignificant increase (p = 0.67), with an APC of 0.17 (95% CI: -0.88 – 1.84). The AAMR for both 2011 and 2020 was 0.89.
Among people living in non-metro areas, the AAMR also exhibited a similar downward trend during the same timeframe, decreasing from 1.62 in 1999 to 1.06 in 2010; the resulting APC was -3.31 (95% CI: -9.44 – -1.82). From 2010 to 2020, the AAMR increased from 1.06 to 1.15, with a nonsignificant (p = 0.64) APC of 0.25 (95% CI: -1.53 – 7.73).
Place of Death
Among 31,358 deaths with known location, 18,228 occurred in a medical setting—17,698 inpatients and 471 outpatient or emergency department deaths—while 5,957 occurred at home, 2,670 in hospice facilities, 3,389 in nursing or long-term-care homes, and 1,017 in other or unspecified locations. Totals reconcile with the full mortality dataset.
Discussion
This study identified a long-term decline in mortality involving colorectal cancer and paralytic ileus, followed by a plateau with a suggestive but non-significant upward trend after 2012. These patterns likely reflect complex and multifactorial changes in perioperative care, patient characteristics, and healthcare access over time. While improvements such as broader adoption of Enhanced Recovery After Surgery (ERAS) protocols, minimally invasive techniques, and improved perioperative management have been associated with early reductions in postoperative mortality, these associations are hypothesized rather than demonstrated in this dataset, as it is based on population-level death certificate records without patient-level clinical variables.
Similarly, the modest post-2012 plateau may coincide with increased opioid exposure, rising multimorbidity, and uneven dissemination of ERAS principles across institutions—factors that are plausible contributors reported in prior literature but cannot be confirmed here. These explanations should therefore be interpreted as contextual hypotheses supported by external evidence, not as causal inferences from the present analysis. This suggests that not everyone is benefiting equally from improvements in surgical care and recovery. Some groups might not be getting the full advantage of new surgical techniques and recovery programs, which highlight how the healthcare system plays a role in patient outcomes over time.
The early drop in mortality likely resulted from adopting better care standards, such as Enhanced Recovery after Surgery (ERAS) protocols, using minimally invasive surgery more often, and improving care around the time of surgery and fluid management [6,7,8]. However, after 2012, progress seemed to slow or reverse. Possible reasons include more opioid use, inconsistent application of ERAS protocols, a rise in other health problems like obesity, and bigger gaps in access to specialized surgery [10,19]. We were particularly worried about the increase in deaths among middle-aged adults, a group that usually sees the most significant benefit from better care. This could be due to more colorectal cancer cases in younger people, diagnosis at a later stage, and higher use of opioids after surgery, or unequal access to quality care [20] [21]. The predominance of inpatient deaths suggests that many individuals experienced acute deterioration related to ileus or its complications, highlighting potential gaps in early recognition, postoperative monitoring, or timely transition to hospice or palliative support. These patterns may also reflect limited access to community-based end-of-life care in certain regions.
From a public-health standpoint, these findings emphasize the importance of consistent ERAS implementation, opioid-sparing perioperative protocols, and improved postoperative monitoring in high-burden regions and among underserved populations. Targeted quality-improvement initiatives may help mitigate preventable morbidity related to paralytic ileus.
Other factors may also have played a role in these trends. Changes in how causes of death are recorded over time might explain part of the recent increase in reported mortality, although this is probably not the main reason. The health of patients has also changed, with more people having other medical conditions, higher obesity rates, and different treatment approaches. Differences in hospital resources and in the consistency with which standard perioperative care is applied may have worsened these trends in some regions and among certain racial or ethnic groups, which could help explain why the improvement in outcomes has not been uniform across patient populations [22,2,1].
Our results match what other studies have shown: age, other health issues, the complexity of the surgery, and postoperative opioid use are all major contributors to paralytic ileus and its complications [23,24]. Our study extends this by showing how these individual risks affect the population’s death rate. The main problem isn’t new risks; it’s the unequal use of proven strategies and the ongoing differences in the quality-of-care people receive.
These findings underscore the need for consistent perioperative practices everywhere. Using fewer opioids for pain, encouraging early movement, carefully managing fluids, and sticking to ERAS protocols are still the best ways to reduce paralytic ileus and improve patient outcomes [25,23]. Healthcare systems need to ensure these practices reach groups and areas that haven’t seen the same improvements, especially middle-aged adults and those disadvantaged by race or location.
Our study is strong because it uses a massive, 25-year national dataset, giving us a broad view of trends across demographics and geography. Using a statistical method called Joinpoint regression helped us clearly identify when things improved and when they stalled.
Limitations
However, this study has several limitations. We used national death certificate data, which lack detailed individual-level information such as tumor stage, surgical approach, opioid use, or hospital practices, limiting causal inference and adjustment for confounding. As a population-level analysis, unmeasured factors and reporting variations over the 25 years may have influenced observed trends. Missing variables—including comorbidities, socioeconomic status, hospital characteristics, and perioperative care details—restrict the ability to fully explain disparities. In addition, updates to ICD-10 cause-of-death coding in the early 2000s, including revisions to valid cause sets, could have introduced minor discontinuities in early-year rates; however, using consistent multiple-cause-of-death fields likely minimized this potential bias. Future research should combine this population-level death data with cancer registries, clinical records, and hospital data to better understand the reasons behind these trends. Looking at why proven best practices are adopted unevenly across hospitals could help explain the inconsistent improvements. Studies focused on implementation could also test whether rolling out ERAS and opioid-sparing protocols to the groups or regions that are struggling can reverse these worrying trends. Moreover, some state-level and smaller racial/ethnic strata contained suppressed death counts (<10 deaths), which CDC WONDER automatically excludes; thus, specific subgroup estimates may be less stable. Second, subgroup analyses were descriptive, as formal interaction testing between strata was not feasible with the available data structure. Finally, death certificate data lack clinical detail, including surgical approach, postoperative opioid exposure, ERAS compliance, and disease stage.
Conclusions
This study demonstrates a sustained national decline in mortality from colorectal cancer complicated by paralytic ileus through 2012, followed by a plateau with a non-significant upward trend thereafter. Disparities persist, with higher mortality in males, older adults, and non-Hispanic Black individuals. The modest post-2012 rise, though not statistically significant, underscores the need for continued attention to middle-aged populations and for equitable implementation of enhanced recovery and opioid-sparing perioperative protocols to prevent paralytic ileus–related deaths.
Conflicts of Interest
The authors declare no competing interests that could have influenced the objectivity or outcome of this research
Funding Source
The authors declare that no specific grant or funding was received for this research from any public, commercial, or not-for-profit funding agency.
Acknowledgments
None
Institutional Review Board (IRB)
None
Large Language Model
Artificial intelligence (AI) tools were used to assist in the preparation of this manuscript. Specifically, ChatGPT (OpenAI, GPT-5, 2025 release) was employed for language editing, style refinement, and consistency checking of terminology and formatting. No AI tool was used to generate, analyze, or interpret study data. All AI-assisted outputs were manually reviewed, verified for factual and methodological accuracy, and edited by the authors prior to submission to ensure compliance with academic integrity and authorship standards.
Authors Contribution
WQ led the conceptualization, study design, supervision, and critical manuscript revision. MH contributed to data collection, methodology development, and initial manuscript drafting. PT performed the literature review, data analysis, and prepared figures and tables. MW conducted statistical analysis, verified results, and assisted with manuscript editing. NM handled project administration and final manuscript review. AA contributed to quality control and manuscript revisions. MM participated in the investigation, validation of findings, and writing of the discussion. YH provided visualization support, technical assistance, and final proofreading of the manuscript.
Data Availability
The data analyzed in this study are publicly available, de-identified U.S. mortality records from the CDC WONDER Multiple Cause of Death (MCOD) database (1999–2023). No new individual-level patient data were generated for this study.
References
- Smith R. E. T., Renaud R. C., Hoffman E.. Colorectal cancer market. Nat Rev Drug Discov. 2004;3(6):471-472.
- Siegel R. L., Miller K. D., Jemal A.. Cancer statistics. 2018. CA Cancer J Clin. 2018;68(1):7-30.
- Granados-Romero J. J., Valderrama-Treviño A. I., Contreras-Flores E. H., Barrera-Mera B., Herrera Enríquez M., Uriarte-Ruíz K., et al. Colorectal cancer: a review. Int J Res Med Sci. 2017;5(11):4667.
- Schwarz N. T., Beer-Stolz D., Simmons R. L., Bauer A. J.. Pathogenesis of Paralytic Ileus. Ann Surg. 2002;235(1):31-40.
- Weledji E. P.. Perspectives on paralytic ileus. Acute Medicine & Surgery. 2020;7(1).
- Chapuis P. H., Bokey L., Keshava A., Rickard M. J. F. X., Stewart P., Young C. J., et al. Risk Factors for Prolonged Ileus After Resection of Colorectal Cancer. Ann Surg. 2013;257(5):909-915.
- Harnsberger C., Maykel J., Alavi K.. Postoperative Ileus. Clin Colon Rectal Surg. 2019;32(03):166-170.
- Millán M., Biondo S., Fraccalvieri D., Frago R., Golda T., Kreisler E.. Risk factors for prolonged postoperative ileus after colorectal cancer surgery. World J Surg. 2012;36(1):179-185. doi:10.1007/s00268-011-1339-5
- Chapuis P. H., Bokey L., Keshava A., Rickard M. J. F. X., Stewart P., Young C. J., et al. Risk factors for prolonged ileus after resection of colorectal cancer: an observational study of 2400 consecutive patients. Ann Surg. 2013;257(5):909-915. doi:10.1097/SLA.0b013e318268a693
- Ju H., Shen K., Li J., Feng Y.. Total postoperative opioid dose is an independent risk factor for prolonged postoperative ileus after laparoscopic colorectal surgery: a case-control study. Korean J Anesthesiol. 2024;77(1):133-138.
- Grigorean V. T., Erchid A., Coman I. S., Liţescu M.. Colorectal Cancer---The ``Parent'' of Low Bowel Obstruction. Medicina (B Aires). 2023;59(5):875.
- World Health Organization. International Statistical Classification of Diseases and Related Health Problems 10th Revision. 2019.
- United States Department of Health and Human Services (US DHHS), Centers for Disease Control and Prevention (CDC), National Center for Health Statistics (NCHS). Provisional Mortality Statistics by Multiple Cause of Death and by Single Race, for 2018 through Present. 2021.
- von Elm E., Altman D. G., Egger M., Pocock S. J., Gøtzsche P. C., Vandenbroucke J. P.. The Strengthening the Reporting of Observational Studies in Epidemiology (STROBE) statement: guidelines for reporting observational studies. J Clin Epidemiol. 2008;61(4):344-349.
- Ingram D. D., Franco S. J.. NCHS Urban-Rural Classification Scheme for Counties. Vital Health Stat. 2013;2(2014):1-73.
- U.S. Census Bureau. internet. 2025 [cited 2025 Sep 1].
- Anderson R. N., Rosenberg H. M.. Age standardization of death rates: implementation of the year 2000 standard. Natl Vital Stat Rep. 1998;47(3):1-16.
- Surveillance Research Program, National Cancer Institute. Joinpoint Regression Software, Version 5.4.0 - April 2025. Bethesda, MD, USA: National Cancer Institute; 2025 [cited 2025 Sep 1].
- Lin Z., Zheng L., Chen Q., Guo Y., Zhao R., Xiao Y., et al. Nomogram for prediction of prolonged postoperative ileus after colorectal resection. BMC Cancer. 2022;22(1):1017. doi:10.1186/s12885-022-10377-x
- Sueta T., Uchino M., Sasaki H., Koike Y., Takesue Y.. Incidence and risk factors for prolonged postoperative ileus after laparoscopic surgery for colorectal cancer in older patients. BMC Surg.. 2022;22(1):69. doi:10.1186/s12893-022-01548-9
- Juo Y. Y., Hyder O., Haider A. H., Camp M., Lidor A. O., Ahuja N.. Ileus after colectomy in the modern era: a population-based analysis. Surgery. 2014;156(5):1153-1162. doi:10.1016/j.surg.2014.06.006
- Choi J., Kang J., Oh H. K., Ahn S., Sohn D. K., Kim D. Y., et al. Intraoperative hypothermia does not affect postoperative ileus after laparoscopic colorectal surgery. World J Surg. 2018;42(5):1532-1538. doi:10.1007/s00268-018-4515-5
- Hinoi T., Kawaguchi Y., Hattori M., Suzuki Y., Ohdan H.. Postoperative ileus in an enhanced recovery pathway: retrospective cohort study. Int J Colorectal Dis. 2017;32(3):411-418. doi:10.1007/s00384-016-2673-8
- Watanabe T., Miyake H., Morii K., Shiozawa M., Takeyama H.. Predictive factors for postoperative ileus after elective right hemicolectomy with high ERAS compliance. Int J Colorectal Dis. 2024;39(1):21-29. doi:10.1007/s00384-023-04400-2
- Boeding J. R. E., Ramphal W., Crolla R. M. P. H., Boonman-de Winter L. J. M., Gobardhan P. D., Schreinemakers J. M. J.. Ileus caused by obstructing colorectal cancer-impact on long-term survival. International journal of colorectal disease. 2018;33(10):1393-1400. doi:10.1007/s00384-018-3132-5