Multiple Myeloma and Chronic Kidney Disease–Related Mortality, 1999–2023: A Population-Based Time-Trend Analysis
Alyaa Ahmed IbrahimⒾ1*, Mohamed Fawzi HemidaⒾ1, Amro AliⒾ2, Raveen MujeebⒾ3, Mohammad Rayyan FaisalⒾ3, Mahmoud TablawyⒾ4, Krish PatelⒾ5, Maryam SaghirⒾ6, Eshal SaghirⒾ3, Sara Hasanin7, Ahmed Atef MohamedⒾ8, Safeya FawziⒾ9, Arwa Khaled DessoukyⒾ1, Ahmed KhairyⒾ1, Asmaa MohamedⒾ10, Abdelrhman H. MohamedⒾ11, Abdullah Farahat ElbannaⒾ12
- 1Alexandria Faculty of Medicine, Alexandria University, Alexandria, Egypt
- 2Department of Medicine, Community Regional Medical Center, Fresno, California, USA
- 3Department of Medicine, Dow University of Health Sciences, Karachi, Pakistan
- 4Faculty of Medicine, Al-Azhar University, Cairo, Egypt
- 5C. U. Shah Medical College, Saurashtra University, Surendranagar, Gujarat, India
- 6Department of Medicine, Jinnah Sindh Medical University, Karachi, Pakistan
- 7Faculty of Medicine, Menoufia University, Menoufia, Egypt
- 8Faculty of Medicine, Helwan University, Cairo, Egypt
- 9Faculty of Nursing, Matrouh University, Marsa Matrouh, Egypt
- 10Faculty of Medicine, Mansoura University, Mansoura, Egypt
- 11Faculty of Medicine, Luxor University, Luxor, Egypt
- 12Department of Medicine, Division of Rheumatology and Immunology, Vanderbilt University Medical Center, Nashville, TN, USA
Abstract
Background: Multiple Myeloma (MM) is the second most common hematological cancer, with chronic kidney disease (CKD) representing a major complication. This study aims to analyze national mortality trends, demographic differences, and geographic variation related to MM and CKD.
Methods: Nationwide mortality records were obtained from the CDC-WONDER database from 1999 to 2023 among U.S. adults aged ≥ 45 with MM (C90.0) and CKD (N18); Deaths recorded anywhere on the death certificate (multiple-cause). Age-adjusted mortality rates (AAMRs) per 100,000 populations were calculated for variables. Joinpoint regression analysis was utilized to evaluate annual percent changes (APCs).
Results: From 1999 to 2023, a total of 24,606 deaths occurred among adults with MM and CKD in the U.S. The overall AAMR increased from (0.65) in 1999 to (0.86) in 2023 (AAPC: 1.22; 95% CI: 0.54 to 2.00; p<0.001). Males had a higher overall AAMR (1.09) and a more rapid increase (AAPC: 1.40; p<0.001) compared to females (AAMR: 0.60; AAPC: 0.71; p=0.027). Racially, NH Blacks had the highest AAMR (2.14). Regionally, the highest AAMRs were in the South (0.83). Metropolitan areas had a higher overall AAMR 0.81 than Non-metropolitan areas 0.77 (available 1999–2020 only). Most deaths occurred in inpatient medical facilities (46.27%). Among adults aged ≥ 65 years, overall CMR was 1.80 per 100,000.
Conclusion: Mortality from MM and CKD is increasing in the U.S from 1999 to 2023. NH Blacks, males, urban areas and the South region face high burden of death, underscoring the need for targeted strategies to reduce these substantial disparities.
Keywords: Multiple Myeloma, Chronic Kidney Disease, Trends, Disparities
Article information
Introduction
Multiple myeloma (MM) is the second most common hematological cancer, resulting from the accumulation of malignant plasma cells in the bone marrow, mainly affecting the elderly and accounting for almost 10% of all hematologic malignancies [1,2,3]. The diagnosis of MM requires a 10% or greater presence of malignant plasma cells along with at least one characteristic MM finding, which includes anemia, renal insufficiency, hypercalcemia, and bone destruction [4]. The organ damage is due to a monoclonal protein produced in the blood or urine [5]. In 2019, there were 155,688 MM cases worldwide, with an age-standardized incidence rate (ASIR) of 1.92/100,000 people. The incidence of MM increases with age [6]. The median age at diagnosis of MM is approximately 70 years; 37% were <65 years, 26% were 65–74 years, and 37% ≥ 75 years of age. MM is extremely rare in patients aged <30 years, with an incidence of 0.02–0.3%, which is higher in males than in females [7]. Significant disparities exist, with incidence rates among non-Hispanic Black Americans being more than two-fold higher compared to their non-Hispanic White counterparts, as well as disproportionately higher five-year mortality rates. In contrast, Asian American and Pacific Islander (AAPI) individuals consistently demonstrated the lowest rates of MM incidence and mortality [8].
Chronic kidney disease (CKD) (Glomerular Filtration Rate <60ml/min/1.73 m2), characterized by reduced kidney function or kidney damage for at least 3 months, affects more than 11% of adults in the United States. CKD and acute kidney injury (AKI) are major complications of MM, affecting a third of patients at presentation and nearly 50% at some point during the course of the disease [9,10,11], with a complex pathophysiology and various underlying risk factors. The toxicity of immunoglobulin light chain deposition in the renal tubules is the main cause of renal dysfunction in these patients. A variety of factors may contribute to renal damage, including hypercalcemia of malignancy, dehydration, infections, amyloidosis, and tumor lysis syndrome. Adding to the kidney damage caused by their disease, patients with MM may receive treatments that are nephrotoxic, such as chemotherapy, targeted anti-cancer agents, and supportive care such as analgesics, antibiotics, and intravenous (IV bisphosphonates [12].
Despite the well-established link between MM and CKD, there is still limited population-based evidence on how these two conditions impact mortality in the United States. Most of what we know comes from small cohorts or institutional studies, which do not reflect broader national patterns. To the best of our knowledge, no study has yet used the Centers for Disease Control and Prevention Wide-Ranging Online Data for Epidemiologic Research (CDC WONDER) database to explore these trends or highlight disparities across different groups.
This study aims to analyze national mortality trends associated with MM and CKD using the CDC WONDER database. Specifically, the study aims to examine temporal changes, demographic patterns, and geographic variations in mortality, with the goal of better understanding the burden of MM-related kidney complications and providing insights that can inform future public health strategies and clinical management.
Methods
Study Design
We conducted a retrospective analysis using death certificate data retrieved from the CDC WONDER database and analyzed data for adults aged 45 and older between 1999 and 2023. We selected 1999 as the start year, corresponding to the US implementation of ICD-10 coding for mortality data, to ensure consistency in coding across the study period. We aimed to assess long-term mortality trends in MM and CKD, using the International Statistical Classification of Diseases and Related Health Problems-10th Revision (ICD-10) as follows: C90.0 for MM rather than related plasma cell disorders and N18, encompassing all CKD stages (1-5 and ESRD), capturing the full spectrum of CKD in this population. These ICD codes have been previously used to identify MM and CKD in administrative databases [13,14], both as contributing or multiple causes of death, as the primary outcomes of this study were MM and CKD-related mortality. These were identified using publicly available Multiple Cause-of-Death mortality data from the CDC WONDER database. Deaths were included if MM and CKD were listed anywhere on the death certificate, either as the underlying causes or as the contributing causes of death. This comprehensive approach ensures the capture of all deaths where MM and CKD played documented roles, regardless of their position on the death certificate. Additionally, the age threshold was selected based on the reliability and completeness of data within the CDC WONDER database. Preliminary explorations indicated substantial suppression of mortality data among individuals under 45 years due to small cell counts, which could lead to unstable rate estimates. Therefore, focusing on adults aged 45 years and older allowed for consistent trend evaluation and demographic comparisons. Furthermore, this age cut-off has been identified in similar studies [15]. Institutional review board approval was not required for this study, as it utilized de-identified public-use data provided by the government and adhered to the Strengthening the Reporting of Observational Studies in Epidemiology (STROBE) guidelines for reporting [16].
Data Abstraction
Data on population size and demographics, including sex, age, race, and region, were extracted. The place of death was categorized into medical facilities, hospice, home, and nursing home/long-term care facilities. Racial and ethnic categories were classified as non-Hispanic (NH) White, NH Black or African American, Hispanic or Latino, NH American Indian or Alaskan Native, and NH Asian or Pacific Islander. Race/ethnicity data transitioned from bridged-race categories (1999-2002) to single-race categories (2003 and later) in accordance with OMB standards [17]. We present trends by race with awareness that comparability across this transition has limitations, particularly for multiracial individuals. The National Center for Health Statistics (NCHS) Urban-Rural Classification Scheme was used to categorize the population by urban and rural counties, based on the 2013 U.S. census classification. We applied this scheme retrospectively to all study years using county FIPS codes. Counties that changed classification during the study period retained their 2013 classification for consistency. It is important to note that urban-rural data were consistently available and analyzed only for the period 1999–2020 due to historical limitations in CDC WONDER stratifications [18]. Regions were stratified into four categories: Northeast, Midwest, South, and West, according to the U.S. Census Bureau’s definitions [19]. Age groups were divided into ten-year intervals.
Statistical Analysis
Crude mortality rates (CMRs) and age-adjusted mortality rates (AAMRs) per 100,000 population from 1999 to 2023, by year, sex, race/ethnicity, state, and urban-rural status, with 95% CIs, were calculated using the 2000 U.S. population as the standard. This standard was used to maintain consistency with CDC WONDER default settings and facilitate comparison with other published mortality studies that use the same standard, as some studies have mentioned that they employed the same standard [20]. Rates were age-adjusted to the 2000 U.S. standard and restricted to adults ≥45; denominators were year-specific ≥45 U.S. populations [21]. CMR was determined by dividing the number of MM and CKD deaths of adults aged ≥45 by the corresponding U.S. population of that year. The National Cancer Institute’s Joinpoint Regression Program 5.4.0.0 was used to determine Annual Percent Change (APC) values for AAMR in the analysis of temporal trends in AAMR over the study period. This method identifies points where the rate of change of the trend is statistically significant (joinpoints) and estimates APC for each segment. The model selection procedure utilized permutation tests to determine the optimal number of joinpoints, ensuring model fit [22]. APC describes the rate of change of AAMR over time, providing a suitable measure to observe trends in mortality rates. A positive value indicates an increase, while a negative value reflects a decrease in mortality rates. The Average Annual Percent Change (AAPC) was calculated to summarize the overall trend across the entire study period. Results are presented with 95% Confidence Intervals, with p < 0.05 deemed statistically significant. It’s worth mentioning that because multiple APCs were estimated, the possibility of chance findings due to multiple testing cannot be excluded. Therefore, the results should be interpreted cautiously, with an emphasis on overall patterns rather than isolated significant values. We also emphasize confidence interval widths and effect magnitude over p-values, recognizing that large sample sizes may yield statistically significant but clinically trivial differences.
Results
Overall Trends
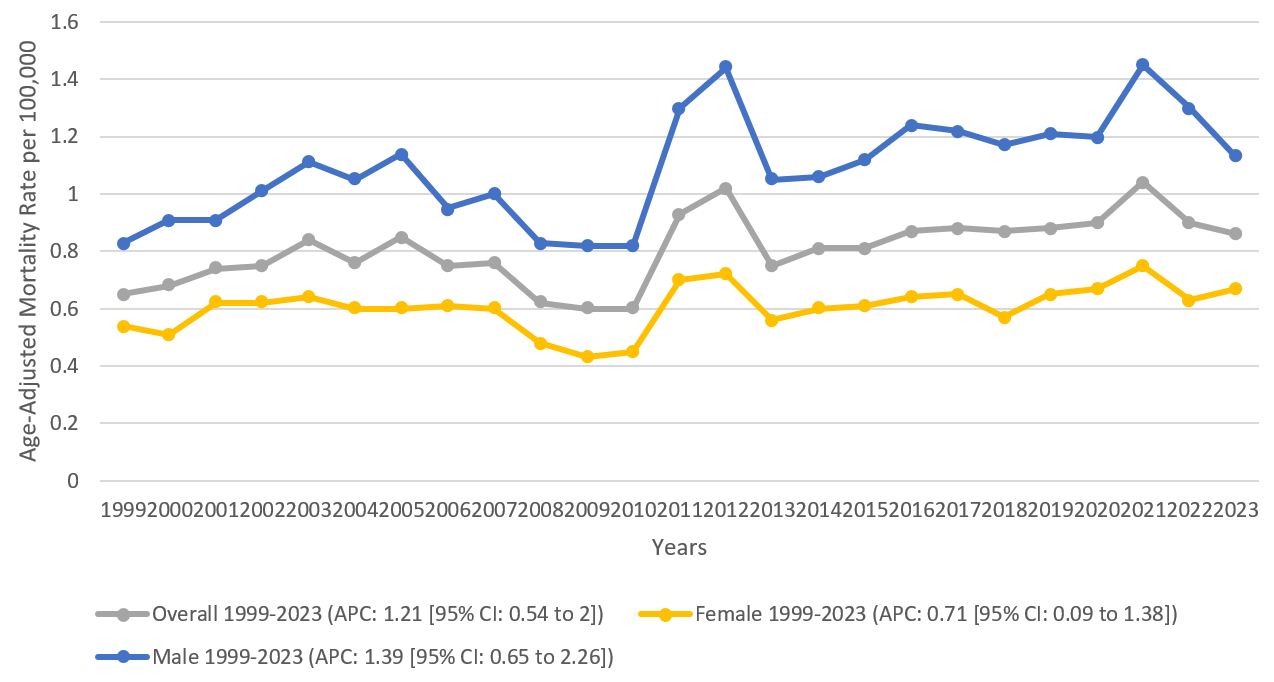
MM and CKD-related deaths accounted for a total of 24,606 deaths among adults aged 45 years and older in the United States from 1999 to 2023. The overall AAMR increased gradually from 0.65 (95% CI: 0.60 to 0.71) in 1999 to 0.86 (95% CI: 0.81 to 0.91) in 2023, with an AAPC of 1.22 (95% CI: 0.54 to 2.00; p < 0.001). No joinpoints were identified during the entire period. Most deaths were reported in medical facilities as inpatients (46.27%), followed by decedents’ homes (26.08%), nursing homes or long-term care settings (13.29%), hospice facilities (7.35%), other locations (3.28%), outpatient or emergency room settings (3.24%), medical facilities - dead on arrival (0.21%), medical facilities - status unknown (0.08%). For 0.18% of cases, the place of death was unknown. (Supplemental Table 1, 2, and 3) Figure 1
Gender Trends
From 1999 to 2023, 14,275 deaths were recorded among males and 10,331 among females. The overall AAMR was higher in males (1.09, 95% CI: 1.00 to 1.18) than in females (0.60, 95% CI: 0.54 to 0.66). On average, males experienced a greater increase than females [Males: AAPC: 1.40 (95% CI: 0.66 to 2.27; p < 0.001); Females: AAPC: 0.71 (95% CI: 0.09 to 1.38; p = 0.027)]. Among males, the AAMR showed a significant increase from 0.83 (95% CI: 0.74 to 0.93) in 1999 to 1.13 (95% CI: 1.05 to 1.22) in 2023, while in females it rose slightly from 0.54 (95% CI: 0.48 to 0.60) in 1999 to 0.67 (95% CI: 0.62 to 0.73) in 2023, with no joinpoints detected. (Supplemental Table 1, 3, and 4) Figure 1.
Race/Ethnicity Trends
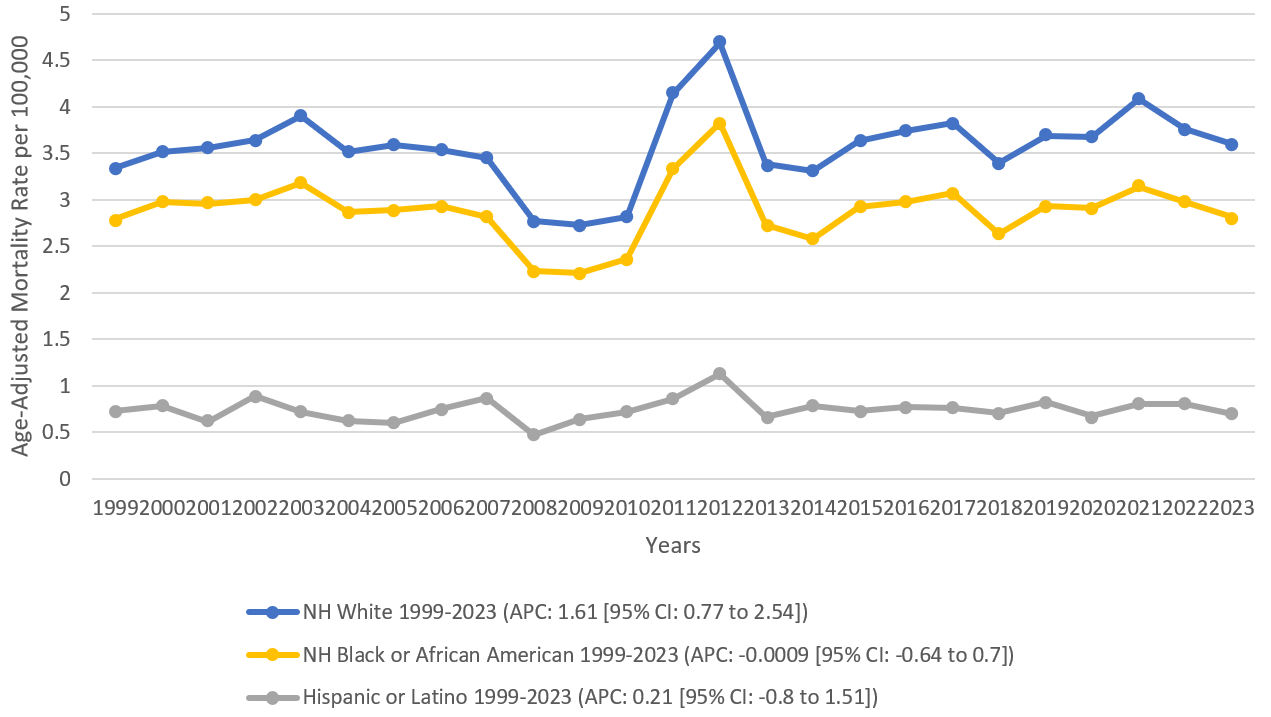
The highest AAMRs were recorded among NH Blacks (2.14, 95% CI: 1.86 to 2.42), followed by Hispanics (0.74, 95% CI: 0.57 to 0.95) and NH Whites (0.69, 95% CI: 0.64 to 0.74). Distinct trends were observed across these groups with zero joinpoints [NH White: AAPC: 1.62 (95% CI: 0.78 to 2.54; p < 0.001); Hispanic: AAPC: 0.21 (95% CI: -0.81 to 1.51; p = 0.545); NH Black: AAPC: -0.001 (95% CI: -0.64 to 0.71; p = 0.925)]. The AAMR increased moderately from 0.55 (95% CI: 0.50 to 0.61) in 1999 to 0.79 (95% CI: 0.73 to 0.84) in 2023 among NH Whites, followed by a slight increase from 2.06 (95% CI: 1.75 to 2.38) in 1999 to 2.11 (95% CI: 1.87 to 2.36) in 2023 among NH Blacks, and remained stable from 0.73 (95% CI: 0.51 to 1.01) in 1999 to 0.70 (95% CI: 0.56 to 0.84) in 2023 among Hispanics. (Supplemental Table 1, 3, and 5) Figure 2.
For American Indian or Alaska Native and NH Asian or Pacific Islander populations, data were suppressed in several years because of a very small number of deaths. The suppressed data did not significantly impact overall or subgroup trends.
Age-specific Trends
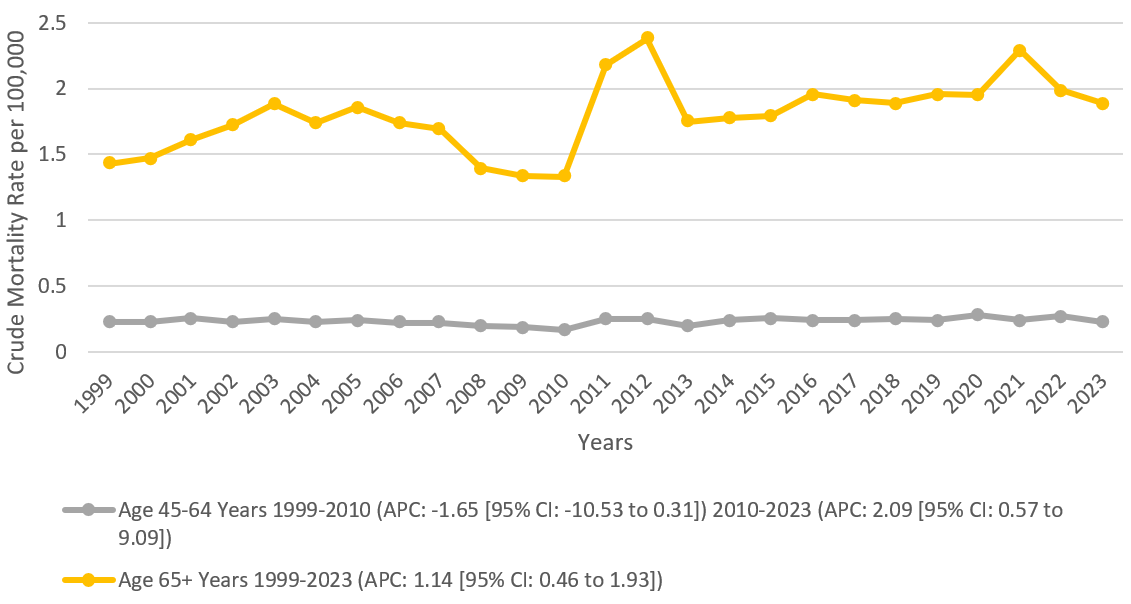
Clear differences were observed between middle-aged and older adults. The overall CMR was higher for those aged 65 years and older (1.80, 95% CI: 1.67-1.92) compared to those aged 45-64 years (0.23, 95% CI: 0.20-0.27). On average, CMRs for both groups changed between 1999 and 2023 [45-64 years: AAPC: 0.36 (95% CI: -0.57 to 1.31; p = 0.466); 65+ years: AAPC: 1.14 (95% CI: 0.47 to 1.93; p = 0.002)]. In adults aged 45-64 years, CMR decreased from 0.23 (95% CI: 0.20-0.27) in 1999 to 0.17 (95% CI: 0.14-0.20) in 2010, then increased to 0.23 (95% CI: 0.20-0.26) in 2023. Whereas, among adults aged 65 years and older, CMR increased from 1.43 (95% CI: 1.31 to 1.56) in 1999 to 1.89 (95% CI: 1.78 to 2.00) in 2023, with no joinpoints observed. (Supplemental Table 3 and 6) Figure 3.
Regional Trends
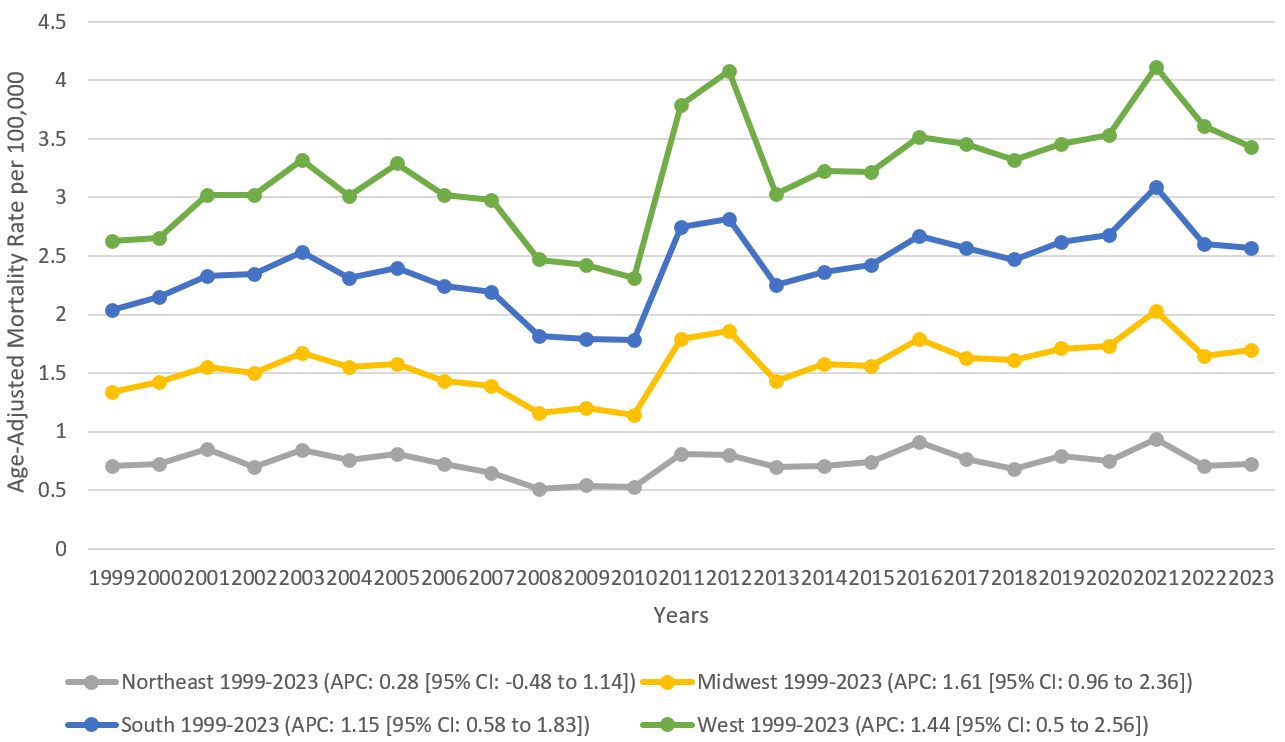
During the study period, the highest mortality was observed in the South (0.83; 95% CI: 0.75 to 0.92), followed by the Midwest (AAMR: 0.82; 95% CI: 0.71 to 0.93), West (0.81; 95% CI: 0.70 to 0.92), and Northeast (0.73; 95% CI: 0.62 to 0.85). While the South exhibited the highest AAMR, the Midwest showed the most significant relative increase over time [AAPC: 1.62; 95% CI: 0.96-2.36; p < 0.001]. In the Northeast, the AAMR remained relatively stable from 0.71 (95% CI: 0.59 to 0.82) in 1999 to 0.72 (95% CI: 0.62 to 0.82) in 2023, with no joinpoints identified (AAPC: 0.28; 95% CI: -0.49 to 1.14; p = 0.460). In the Midwest, mortality increased from 0.63 (95% CI: 0.53 to 0.74) in 1999 to 0.98 (95% CI: 0.86 to 1.09) in 2023, with no joinpoints. In the South, the rate rose from 0.70 (95% CI: 0.61 to 0.79) in 1999 to 0.87 (95% CI: 0.80 to 0.95) in 2023, with no joinpoints (AAPC: 1.15; 95% CI: 0.59 to 1.83; p < 0.001). In the West, AAMR increased from 0.59 (95% CI: 0.48 to 0.70) in 1999 to 0.86 (95% CI: 0.76 to 0.96) in 2023, with no joinpoints (AAPC: 1.44; 95% CI: 0.51 to 2.57; p = 0.004). (Supplemental Table 3 and 7) Figure 4
Urbanization Trends
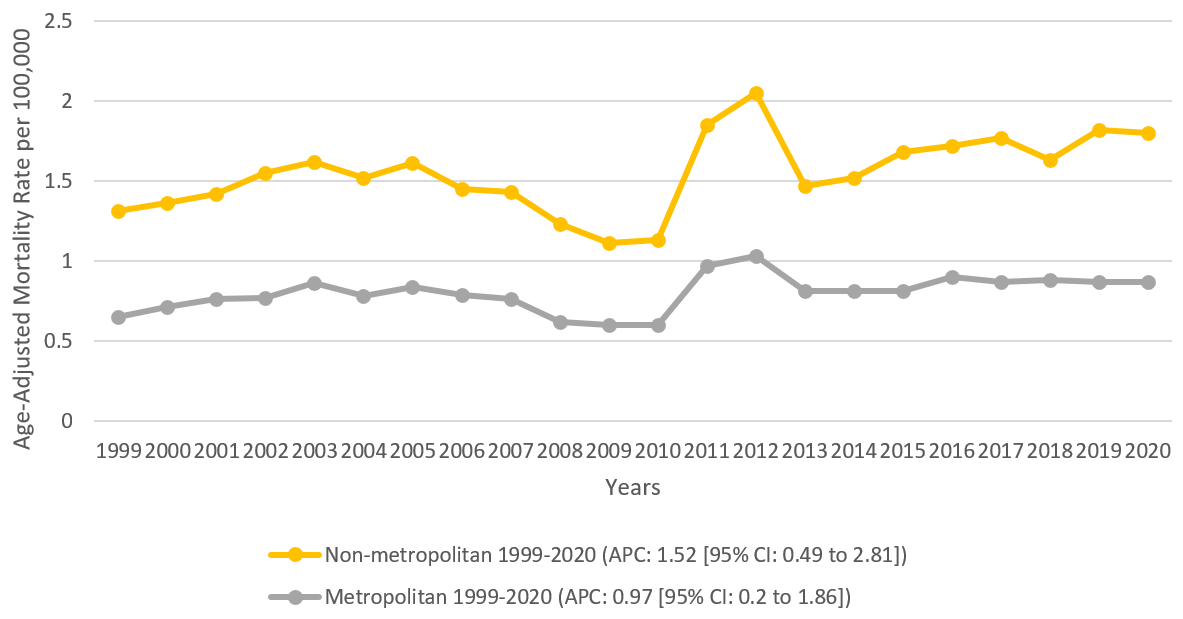
Urbanization trends were analyzed from 1999 to 2020. During this study period, the overall AAMR was higher in metropolitan areas (0.81; 95% CI, 0.80-0.82) compared to non-metropolitan areas (0.77; 95% CI, 0.74-0.79). The increase was more pronounced in non-metropolitan areas [AAPC: 1.53; 95% CI: 0.49 to 2.81; p = 0.006] than metropolitan areas [AAPC: 0.97; 95% CI: 0.20 to 1.86; p = 0.012]. In metropolitan areas, the AAMR increased from 0.65 (95% CI: 0.60-0.71) in 1999 to 0.87 (95% CI: 0.81-0.92) in 2020, with no significant joinpoints detected. In non-metropolitan areas, mortality increased from 0.66 (95% CI: 0.54-0.78) in 1999 to 0.93 (95% CI: 0.81-1.05) in 2020, with no observed join points. (Supplemental Table 3 and 8) Figure 5
Discussion
Using the CDC WONDER Database for adults 45 years and older between 1999 and 2023, we aim to identify trends and potential disparities related to MM and CKD mortalities in terms of age, gender, race, region, and urbanization. Recognizing disparities will hopefully lead to some actionable steps to relieve some avoidable causes of death related to MM and CKD. In this study, we found a significant increase in the total number of deaths and AAMR between 1999 and 2023. This increase in the total reported number of deaths could be explained by the advancements related to pinpointing MM diagnoses and associated CKD. The predominance of inpatient deaths (46.3%) underscores the high-acuity nature of terminal events in patients with both MM and CKD, possibly reflecting complications such as infections, AKI superimposed on CKD, or MM-related crises. The relatively low hospice utilization (7.4%) compared to other cancers suggests potential underutilization of palliative care services in this population. The study reflected that most deaths affect elderly individuals. The rate of deaths was also notably higher in males compared to females, with males also having a more rapid progression in the number of deaths compared to females. Racial disparities were observed with a prominently increased mortality rate in NH blacks compared to other ethnicities. The South had the highest mortality level, and the Midwest showed the fastest deterioration (AAPC). Metropolitan areas experienced higher mortality rates compared to non-metropolitan areas, but performed better in terms of the rate of progression.
Our findings support that mortality increases with age, more precisely in individuals older than 65 years, having the highest CMR compared to other age groups. As literature suggests, this could be attributed to the disease often getting diagnosed in an advanced stage [23], high tumor burden [24], baseline CKD worsening with age [25], a plethora of other possible comorbidities, and, more importantly, declining functional status [26]. Literature also suggests that elderly individuals would also have a suboptimal tolerance to treatment modalities like chemotherapy [27], reflected by more reported infections and chemotherapy-related toxicities [28]. This, in turn, would also affect their candidacy for autologous stem cell transplantation [29]. It is also noteworthy to mention that for adults aged 45-64 years, there was a slight decrease in CMR between 1999 and 2010, but it subsequently bounced back to its baseline value in 2023, compared to 1999.
Men had significantly more reported deaths related to MM and CKD between 1999 and 2023, with almost double the AAMR and AAPC compared to females. Based on a literature search, which is beyond the scope of this study, we identified some hypotheses that may support our findings. It is reported in literature that MM exhibits more aggressive disease features in males based on certain high-risk cytogenetic variations linked to poor outcomes being more reported in males [30]. The literature also suggests that, when it comes to CKD, men are reported to have a more rapid decline in kidney function [31] and are more likely to suffer from ESRD requiring dialysis [32], which carries its own bundle of challenges and possible complications [33]. Men are also reported to have a higher comorbidity burden, such as cardiovascular diseases and HTN, that would negatively affect one’s chances for recovery [34]. Monoclonal gammopathy of undetermined significance MGUS and monoclonal gammopathy of renal significance MGRS are possible precursors to MM, and are reported to be more prevalent in men [35,36,37]. Men are also reported to underutilize preventive visits, which might delay diagnosis and exacerbate complications [38].
NH Blacks had the highest mortality rate by far among ethnic groups, followed by Hispanics, then NH Whites. NH Blacks are reported to have a higher incidence of MM, earlier age of onset, and a higher chance of developing renal disease, subjecting them to more complications and eventually poorer outcomes [39]. The literature also suggests that NH Blacks are reported to possibly have some genetic mutations linked to poor outcomes related to MM [40]. Factors such as socioeconomic status, access to health care, region/urbanization (as discussed in the following paragraphs), underutilization of treatment and palliative resources play a huge role in why NH Blacks and Hispanics have a higher mortality rate. It is noteworthy that NH Whites had the highest rate of progression, reflected by AAPC [41]. Based on the literature search, the root cause of these findings is unclear. Still, it could be related to the rapid rise in metabolic syndrome among white people [42], and more decent access to healthcare leading to more accurate diagnosis and documentation compared to other groups [43]. While NH Whites showed the largest relative increase (AAPC 1.62%), NH Blacks maintained substantially higher absolute mortality rates (AAMR 2.14 vs. 0.69), indicating persistent disparities that require urgent intervention, despite slower growth rates.
Our study indicates that the highest mortality rates took place in the South and the Midwest, followed by the West, and then the Northeast. The Midwest showed the most rapid deterioration reflected by its AAPC, followed by the West, and then the South. This could be explained by the racial composition of these regions being relatively more populated by NH Blacks and Hispanics [44]. This could also be explained by a higher incidence of comorbidities such as obesity, DM, and HTN in certain areas within these regions [45].
AAMR was reported to be slightly higher in Metropolitan areas compared to non-metropolitan areas; however, non-metropolitan areas experienced a more rapid increase in mortality. Non-metropolitan areas have limited access to healthcare and longer wait times to establish care with primary care physicians, and subsequently, hematologists and oncologists, which can lead to delays in diagnosis and increased time for complications to develop [46]. Being in rural areas, especially for low-income individuals, would make it difficult to have access to novel therapies and autologous stem cell transplant capable facilities [47]. Rural areas also have a higher percentage of uninsured and underinsured individuals [48]. Suboptimal social determinants of health in rural areas will deepen the vulnerability of rural communities and lead to increased mortalities across all health-related aspects [49].
Reflecting on our findings and the literature search, MM has been heavily researched over the last two decades, and our study period encompassed transformative advances in MM therapeutics, including proteasome inhibitors, immunomodulatory drugs, monoclonal antibodies, and CAR-T cell therapy [50]. While these innovations improved survival in clinical trials, their population-level impact on patients with concurrent CKD may differ, as renal impairment often limits treatment options and dosing [51,52]. The increasing mortality we observed may reflect improved diagnosis and longer survival with MM (allowing time for CKD to develop), competing risks, or differential access to novel therapies across demographic groups.
Limitations
Our study has certain limitations that should be considered when interpreting these data. We used the CDC WONDER Database, which relies on death certificates and specific ICD coding versions, thereby subjecting the data to potential misinterpretation and inaccurate documentation. This is highly operator-dependent, and healthcare personnel may not accurately list all active pathologies that contributed to a patient’s demise. For example, a patient might be documented to pass away from respiratory failure, omitting the fact that the patient might have developed pneumonia due to immunosuppression in the setting of MM treatment, or respiratory failure from fluid overload in the setting of renal failure. Our data couldn’t distinguish whether MM, renal disease, or another cause was the underlying cause of death. The concept is referred to as multiple-cause deaths, which should encompass all pathologies or causes that led to the patient’s demise, which are usually an immediate cause of death, an underlying cause of death, and other contributing conditions. Data also didn’t account for some relevant clinical variables that could give us more accurate stratifications. Some of these clinical variables include family history of the diseases in question, comorbidities, age at diagnosis, stages of CKD, progression to ESRD requiring dialysis, modalities pursued for treatment, and treatment-related toxicities. Knowing some of these variables could help us better distinguish between causality and correlation in the relationship between MM, renal disease, and their associated mortalities. The database also typically does not report socioeconomic status, environmental exposure, and certain health-related behaviors, such as smoking, substance abuse, and dietary habits. A key limitation in using datasets is the temporal coverage differences; for example, some datasets start or stop collecting certain data in different years or change their collection methods, leading to incomplete data, as urbanization data was limited to 2020 only. Coding transitions, which refer to changes in how diseases or causes of death are coded over time, pose a significant challenge in collecting data. The data is also often suppressed when it comes to fewer events and smaller health institutions or groups, to protect patients’ privacy. For example, data for Native Americans was suppressed, but the exact percentage couldn’t be quantified.
Conclusions
In conclusion, using CDC WONDER data for adults 45 and older from 1999 to 2023, mortality rates from MM and CKD have consistently increased in the United States from 1999 to 2023. The South region reported the highest mortality rates, whereas the Midwest witnessed the most rapid increase in these rates. Urban locations typically displayed greater death rates, while rural regions exhibited a more pronounced upward trend. These findings support targeted interventions including: (1) enhanced CKD screening in MM patients, particularly NH Black individuals; (2) equitable access to nephroprotective MM regimens; (3) expanded telemedicine and specialty care in rural areas; and (4) investigation of biologic and social determinants underlying observed racial disparities.
Conflicts of Interest
The authors declare no competing interests that could have influenced the objectivity or outcome of this research.
Funding Source
This research did not receive any specific grant from funding agencies in the public, commercial, or not-for-profit sectors
Acknowledgments
None
Institutional Review Board (IRB)
Ethical approval was not required for the study.
Large Language Model
None
Authors Contribution
AAI and MFH Conceptualization, Writing-original draft, Writing-review editing. AA, RM, MT, MS, ES, SH, AAM, SF, AKD, AK, MA, AM, AHM Writing-original draft. MRF Formal Analysis. KP Data Extraction. AFE Writing-review editing, Validation, Supervision.
Data Availability
The data supporting the findings of this study are publicly available in CDC-WONDER at https://wonder.cdc.gov/. The data supporting the findings of this study were obtained from the CDC WONDER online database (Centers for Disease Control and Prevention Wide-ranging Online Data for Epidemiologic Research). Further inquiries can be directed to the corresponding author.
References
- Doddi S., Rashid M. H.. Disparities in Multiple Myeloma Mortality Rate Trends by Demographic Status in the USA. Cancer Diagn Progn. 2024;4(3):288-294. doi:10.21873/cdp.10322 PMID: 38707728 PMCID: PMC11062173
- Katagiri D., Noiri E., Hinoshita F.. Multiple myeloma and kidney disease. ScientificWorldJournal. 2013;2013:487285. doi:10.1155/2013/487285 PMID: 24288486 PMCID: PMC3826468
- Smith L., McCourt O., Henrich M., Paton B., Yong K., Wardle J., Fisher A.. Multiple myeloma and physical activity: a scoping review. BMJ Open. 2015;5(11):e009576. doi:10.1136/bmjopen-2015-009576 PMID: 26614625 PMCID: PMC4663409
- Chakraborty R., Majhail N. S.. Treatment and disease-related complications in multiple myeloma: Implications for survivorship. Am J Hematol. 2020;95(6):672-690. doi:10.1002/ajh.25764 PMID: 32086970 PMCID: PMC7217756
- Gozzetti A., Candi V., Papini G., Bocchia M.. Therapeutic advancements in multiple myeloma. Front Oncol. 2014;4:241. doi:10.3389/fonc.2014.00241 PMID: 25237651 PMCID: PMC4154387
- Touzeau C., Raguideau F., Denis H., Lamarsalle L., Guilmet C., Javelot M., Pierres M., Perrot A.. Epidemiology of patients treated for multiple myeloma using a new algorithm in the French national health insurance database (SNDS): Results from the MYLORD study. PLoS One. 2025;20(5):e0322474. doi:10.1371/journal.pone.0322474 PMID: 40338880 PMCID: PMC12061088
- Zhou L., Yu Q., Wei G., Wang L., Huang Y., Hu K., Hu Y., Huang H.. Measuring the global, regional, and national burden of multiple myeloma from 1990 to 2019. BMC Cancer. 2021;21(1):606. doi:10.1186/s12885-021-08280-y PMID: 34034700 PMCID: PMC8152089
- Zhu D. T., Park A., Lai A., Zhang L., Attar H., Rebbeck T. R.. Multiple myeloma incidence and mortality trends in the United States, 1999-2020. Sci Rep. 2024;14(1):14564. doi:10.1038/s41598-024-65590-4 PMID: 38914692 PMCID: PMC11196710
- Lazana I., Floro L., Christmas T., Shah S., Bramham K., Cuthill K., Bassett P., Schey S., Kazmi M., Potter V., Pagliuca A., Streetly M., Benjamin R.. Autologous stem cell transplantation for multiple myeloma patients with chronic kidney disease: a safe and effective option. Bone Marrow Transplant. 2022;57(6):959-965. doi:10.1038/s41409-022-01657-y PMID: 35413986 PMCID: PMC9200631
- Molina-Andujar A., Robles P., Cibeira M. T., Montagud-Marrahi E., Guillen E., Xipell M., Blasco M., Poch E., Rosinol L., Blade J., Quintana L. F.. The renal range of the kappa/lambda sFLC ratio: best strategy to evaluate multiple myeloma in patients with chronic kidney disease. BMC Nephrol. 2020;21(1):111. doi:10.1186/s12882-020-01771-3 PMID: 32234026 PMCID: PMC7110749
- Sandsmark D. K., Messe S. R., Zhang X., Roy J., Nessel L., Lee Hamm L., He J., Horwitz E. J., Jaar B. G., Kallem R. R., Kusek J. W., Mohler E. R., 3rd, Porter A., Seliger S. L., Sozio S. M., Townsend R. R., Feldman H. I., Kasner S. E., CRIC Study Investigators. Proteinuria, but Not eGFR, Predicts Stroke Risk in Chronic Kidney Disease: Chronic Renal Insufficiency Cohort Study. Stroke. 2015;46(8):2075-80. doi:10.1161/STROKEAHA.115.009861 PMID: 26130097 PMCID: PMC4519405
- Qian Y., Bhowmik D., Bond C., Wang S., Colman S., Hernandez R. K., Cheng P., Intorcia M.. Renal impairment and use of nephrotoxic agents in patients with multiple myeloma in the clinical practice setting in the United States. Cancer Med. 2017;6(7):1523-1530. doi:10.1002/cam4.1075 PMID: 28612485 PMCID: PMC5504317
- Ibrahim Alyaa Ahmed, Hemida Mohamed Fawzi, Sharma Bhavya, Patel Krish, Qadri Maria, Alsaadi Mustafa, Arafa Amr Ossama. MM-1180: Persistent Disparities in Multiple Myeloma and Renal Disease Mortality Across US Demographics and Regions (1999–2020): A CDC WONDER Database Analysis. Clinical Lymphoma Myeloma and Leukemia. 2025;25:S971-S972. doi:10.1016/s2152-2650(25)02697-7
- Shahid H., Haseeb A., Iftikhar A., Sial F.. Trends in mortality of renal failure in adult multiple myeloma patients: a CDC data analysis (1999-2020). Int Urol Nephrol. 2025. doi:10.1007/s11255-025-04788-5 PMID: 40936059
- Ibrahim Alyaa Ahmed, Hemida Mohamed Fawzi, Hussein Mirna, Saghir Maryam, Faisal Mohammad Rayyan, Kritika F. N. U., Patel Krish, Ali Amro, Saghir Eshal, Tablawy Mahmoud, Mohamed Abdelrhman H., Arafa Amr. Disparities and Trends in Polycythemia Vera–Related Mortality in U.S. Adults Aged ≥45 Years from 1999 to 2023. ASIDE Internal Medicine. 2025;2(3):24-32. doi:10.71079/aside.Im.092725233
- von Elm E., Altman D. G., Egger M., Pocock S. J., Gotzsche P. C., Vandenbroucke J. P., STROBE Initiative. The Strengthening the Reporting of Observational Studies in Epidemiology (STROBE) statement: guidelines for reporting observational studies. J Clin Epidemiol. 2008;61(4):344-9. doi:10.1016/j.jclinepi.2007.11.008 PMID: 18313558
- Centers for Disease Control and Prevention. Race and Ethnicity Measurement Methods - NCHS Rapid Surveys System. 2023.
- Aggarwal R., Chiu N., Loccoh E. C., Kazi D. S., Yeh R. W., Wadhera R. K.. Rural-Urban Disparities: Diabetes, Hypertension, Heart Disease, and Stroke Mortality Among Black and White Adults, 1999-2018. J Am Coll Cardiol. 2021;77(11):1480-1481. doi:10.1016/j.jacc.2021.01.032 PMID: 33736831 PMCID: PMC8210746
- Ingram Deborah D, Franco Sheila J. 2013 NCHS urban-rural classification scheme for counties. 2014.
- Hemida Mohamed Fawzi, Khan Ayesha, Ibrahim Alyaa Ahmed, Goel Anika, Patel Krish, Shahriar Zahin, Hageen Ahmed W., Alsaadi Mustafa, Rahman Saif Ur, Arafa Amr, Kholeif Zeyad, Bahnasy Ahmed. Trends in Mortality from Leukemia and Ischemic Heart Disease: A 22-Year Analysis in the U.S. (1999-2020). ASIDE Internal Medicine. 2025;2(2):21-30. doi:10.71079/aside.Im.091425163
- Anderson R. N., Rosenberg H. M.. Age standardization of death rates: implementation of the year 2000 standard. Natl Vital Stat Rep. 1998;47(3):1-16, 20. PMID: 9796247
- Surveillance Research Program, National Cancer Institute. Joinpoint Regression Program. Joinpoint Trend Analysis Software. 2025.
- Grant S. J., Wildes T. M., Rosko A. E., Silberstein J., Giri S.. A real-world data analysis of predictors of early mortality after a diagnosis of multiple myeloma. Cancer. 2023;129(13):2023-2034. doi:10.1002/cncr.34760 PMID: 36989073 PMCID: PMC10330042
- Urban V. S., Cegledi A., Mikala G.. Multiple myeloma, a quintessential malignant disease of aging: a geroscience perspective on pathogenesis and treatment. Geroscience. 2023;45(2):727-746. doi:10.1007/s11357-022-00698-x PMID: 36508077 PMCID: PMC9742673
- Hommos M. S., Glassock R. J., Rule A. D.. Structural and Functional Changes in Human Kidneys with Healthy Aging. J Am Soc Nephrol. 2017;28(10):2838-2844. doi:10.1681/ASN.2017040421 PMID: 28790143 PMCID: PMC5619977
- Fraz M. A., Warraich F. H., Warraich S. U., Tariq M. J., Warraich Z., Khan A. Y., Usman M., Ijaz A., Tenneti P., Mushtaq A., Akbar F., Shahid Z., Ali Z., Fazeel H. M., Rodriguez C., Nasar A., McBride A., Anwer F.. Special considerations for the treatment of multiple myeloma according to advanced age, comorbidities, frailty and organ dysfunction. Crit Rev Oncol Hematol. 2019;137:18-26. doi:10.1016/j.critrevonc.2019.02.011 PMID: 31014512 PMCID: PMC6508081
- Shpitzer D., Cohen Y. C., Shragai T., Grossberger O., Amsterdam D., Reiner-Benaim A., Avivi I.. Clinical outcomes in older adults treated outside clinical studies: highlighting the octogenarian experience. Blood Adv. 2025;9(11):2677-2685. doi:10.1182/bloodadvances.2025015968 PMID: 40048737 PMCID: PMC12155550
- Blimark C., Holmberg E., Mellqvist U. H., Landgren O., Bjorkholm M., Hultcrantz M., Kjellander C., Turesson I., Kristinsson S. Y.. Multiple myeloma and infections: a population-based study on 9253 multiple myeloma patients. Haematologica. 2015;100(1):107-13. doi:10.3324/haematol.2014.107714 PMID: 25344526 PMCID: PMC4281323
- Belotti A., Ribolla R., Cancelli V., Crippa C., Bianchetti N., Ferrari S., Bottelli C., Cattaneo C., Tucci A., De La Fuente Barrigon C., Rossi G.. Transplant eligibility in elderly multiple myeloma patients: Prospective external validation of the international myeloma working group frailty score and comparison with clinical judgment and other comorbidity scores in unselected patients aged 65-75 years. Am J Hematol. 2020;95(7):759-765. doi:10.1002/ajh.25797 PMID: 32242970
- Branco C., Silva M., Rodrigues N., Vieira J., Forjaz Lacerda J., Lopes J. A.. The Role of High-Risk Cytogenetics in Acute Kidney Injury of Newly Diagnosed Multiple Myeloma: A Cohort Study. Int J Mol Sci. 2025;26(13). doi:10.3390/ijms26136108 PMID: 40649884 PMCID: PMC12249657
- Swartling O., Rydell H., Stendahl M., Segelmark M., Trolle Lagerros Y., Evans M.. CKD Progression and Mortality Among Men and Women: A Nationwide Study in Sweden. Am J Kidney Dis. 2021;78(2):190-199 e1. doi:10.1053/j.ajkd.2020.11.026 PMID: 33434591
- Antlanger M., Noordzij M., van de Luijtgaarden M., Carrero J. J., Palsson R., Finne P., Hemmelder M. H., Areste-Fosalba N., Reisaeter A. V., Cases A., Traynor J. P., Kramar R., Massy Z., Jager K. J., Hecking M., ERA-EDTA Registry. Sex Differences in Kidney Replacement Therapy Initiation and Maintenance. Clin J Am Soc Nephrol. 2019;14(11):1616-1625. doi:10.2215/CJN.04400419 PMID: 31649071 PMCID: PMC6832047
- Vadakedath S., Kandi V.. Dialysis: A Review of the Mechanisms Underlying Complications in the Management of Chronic Renal Failure. Cureus. 2017;9(8):e1603. doi:10.7759/cureus.1603 PMID: 29067226 PMCID: PMC5654453
- Patwardhan V., Gil G. F., Arrieta A., Cagney J., DeGraw E., Herbert M. E., Khalil M., Mullany E. C., O'Connell E. M., Spencer C. N., Stein C., Valikhanova A., Gakidou E., Flor L. S.. Differences across the lifespan between females and males in the top 20 causes of disease burden globally: a systematic analysis of the Global Burden of Disease Study 2021. Lancet Public Health. 2024;9(5):e282-e294. doi:10.1016/S2468-2667(24)00053-7 PMID: 38702093 PMCID: PMC11080072
- Leung N., Bridoux F., Nasr S. H.. Monoclonal Gammopathy of Renal Significance. N Engl J Med. 2021;384(20):1931-1941. doi:10.1056/NEJMra1810907 PMID: 34010532
- Mouhieddine T. H., Weeks L. D., Ghobrial I. M.. Monoclonal gammopathy of undetermined significance. Blood. 2019;133(23):2484-2494. doi:10.1182/blood.2019846782 PMID: 31010848
- Wadhera R. K., Rajkumar S. V.. Prevalence of monoclonal gammopathy of undetermined significance: a systematic review. Mayo Clin Proc. 2010;85(10):933-42. doi:10.4065/mcp.2010.0337 PMID: 20713974 PMCID: PMC2947966
- Viera A. J., Thorpe J. M., Garrett J. M.. Effects of sex, age, and visits on receipt of preventive healthcare services: a secondary analysis of national data. BMC Health Serv Res. 2006;6:15. doi:10.1186/1472-6963-6-15 PMID: 16504097 PMCID: PMC1402283
- Buck T., Hartley-Brown M. A., Efebera Y. A., Milner C. P., Zonder J. A., Richardson P. G., Salinardi T., Rice M. S.. Real-world multiple myeloma risk factors and outcomes by non-Hispanic Black/African American and non- Hispanic White race/ethnicity in the United States. Haematologica. 2024;109(6):1882-1892. doi:10.3324/haematol.2023.282788 PMID: 38031762 PMCID: PMC11141648
- Peres L. C., Colin-Leitzinger C. M., Teng M., Dutil J., Alugubelli R. R., DeAvila G., Teer J. K., Du D., Mo Q., Siegel E. M., Hampton O. A., Alsina M., Brayer J., Blue B., Baz R., Silva A. S., Nishihori T., Shain K. H., Gillis N.. Racial and ethnic differences in clonal hematopoiesis, tumor markers, and outcomes of patients with multiple myeloma. Blood Adv. 2022;6(12):3767-3778. doi:10.1182/bloodadvances.2021006652 PMID: 35500227 PMCID: PMC9631567
- Caraballo C., Ndumele C. D., Roy B., Lu Y., Riley C., Herrin J., Krumholz H. M.. Trends in Racial and Ethnic Disparities in Barriers to Timely Medical Care Among Adults in the US, 1999 to 2018. JAMA Health Forum. 2022;3(10):e223856. doi:10.1001/jamahealthforum.2022.3856 PMID: 36306118 PMCID: PMC9617175
- Moore J. X., Chaudhary N., Akinyemiju T.. Metabolic Syndrome Prevalence by Race/Ethnicity and Sex in the United States, National Health and Nutrition Examination Survey, 1988-2012. Prev Chronic Dis. 2017;14:E24. doi:10.5888/pcd14.160287 PMID: 28301314 PMCID: PMC5364735
- Caraballo C., Massey D., Mahajan S., Lu Y., Annapureddy A. R., Roy B., Riley C., Murugiah K., Valero-Elizondo J., Onuma O., Nunez-Smith M., Forman H. P., Nasir K., Herrin J., Krumholz H. M.. Racial and Ethnic Disparities in Access to Health Care Among Adults in the United States: A 20-Year National Health Interview Survey Analysis, 1999-2018. medRxiv. 2020. doi:10.1101/2020.10.30.20223420 PMID: 33173905 PMCID: PMC7654899
- Saka A. H., Giaquinto A. N., McCullough L. E., Tossas K. Y., Star J., Jemal A., Siegel R. L.. Cancer statistics for African American and Black people, 2025. CA Cancer J Clin. 2025;75(2):111-140. doi:10.3322/caac.21874 PMID: 39976243 PMCID: PMC11929131
- Gurka M. J., Filipp S. L., DeBoer M. D.. Geographical variation in the prevalence of obesity, metabolic syndrome, and diabetes among US adults. Nutr Diabetes. 2018;8(1):14. doi:10.1038/s41387-018-0024-2 PMID: 29549249 PMCID: PMC5856741
- Serchen J., Johnson D., Cline K., Hilden D., Algase L. F., Silberger J. R., Watkins C., Jr., Health and Public Policy Committee and the Medical Practice and Quality Committee of the American College of Physicians. Improving Health and Health Care in Rural Communities: A Position Paper From the American College of Physicians. Ann Intern Med. 2025;178(5):701-704. doi:10.7326/ANNALS-24-03577 PMID: 40163886
- Al-Hamadani M., Hashmi S. K., Go R. S.. Use of autologous hematopoietic cell transplantation as initial therapy in multiple myeloma and the impact of socio-geo-demographic factors in the era of novel agents. Am J Hematol. 2014;89(8):825-30. doi:10.1002/ajh.23753 PMID: 24799343
- Terlizzi Emily P., Cohen Robin A.. Geographic Variation in Health Insurance Coverage: United States, 2022. Natl Health Stat Report. 2023. doi:10.15620/cdc:133320
- Daniel H., Bornstein S. S., Kane G. C., Health and Public Policy Committee of the American College of Physicians, Carney J. K., Gantzer H. E., Henry T. L., Lenchus J. D., Li J. M., McCandless B. M., Nalitt B. R., Viswanathan L., Murphy C. J., Azah A. M., Marks L.. Addressing Social Determinants to Improve Patient Care and Promote Health Equity: An American College of Physicians Position Paper. Ann Intern Med. 2018;168(8):577-578. doi:10.7326/M17-2441 PMID: 29677265
- Mettias S., ElSayed A., Moore J., Berenson J. R.. Multiple Myeloma: Improved Outcomes Resulting from a Rapidly Expanding Number of Therapeutic Options. Target Oncol. 2025;20(2):247-267. doi:10.1007/s11523-024-01122-4 PMID: 39878864
- Dimopoulos M. A., Mikhael J., Terpos E., Leleu X., Moreau P., Blade J., Kim J. S., Stockerl-Goldstein K., Richardson P. G.. An overview of treatment options for patients with relapsed/refractory multiple myeloma and renal impairment. Ther Adv Hematol. 2022;13:20406207221088458. doi:10.1177/20406207221088458 PMID: 35392438 PMCID: PMC8980434
- Dimopoulos M. A., Merlini G., Bridoux F., Leung N., Mikhael J., Harrison S. J., Kastritis E., Garderet L., Gozzetti A., van de Donk Nwcj, Weisel K. C., Badros A. Z., Beksac M., Hillengass J., Mohty M., Ho P. J., Ntanasis-Stathopoulos I., Mateos M. V., Richardson P., Blade J., Moreau P., San-Miguel J., Munshi N., Rajkumar S. V., Durie B. G. M., Ludwig H., Terpos E., International Myeloma Working Group. Management of multiple myeloma-related renal impairment: recommendations from the International Myeloma Working Group. Lancet Oncol. 2023;24(7):e293-e311. doi:10.1016/S1470-2045(23)00223-1 PMID: 37414019