Environmental Monitoring in a Class D Pharmaceutical Facility: Microbial Load and Hygiene Practices, a Risk-Based Cross-Sectional Study
Shrawan Kr. SinghⒾ1*
- 1Quest Pharmaceuticals Pvt Ltd, Birgunj, Madhesh Pradesh, Nepal
Abstract
Background: Environmental monitoring is a crucial current Good Manufacturing Practice (cGMP) tool for assessing the status of the working environment in a Pharmaceutical Manufacturing Facility. Methods: The test was conducted between May 20 and 25, 2025. 90 mm Diameter Settle Plates methods, 4 hours exposure under dynamic conditions, were used as a test method to study the microbial load in controlled and classified areas. The finger dab test was used to assess hygiene and sanitization practices in the plant. The non-viable count was excluded from the study due to limitations, including a lack of facilities for conducting the tests.
Result: The result of the environmental monitoring test was below 100 colony-forming units (CFU) in the rooms. The mean value of Total Aerobic Microbial Count and Total Yeast and Mold Count show a higher microbial count at the Near Return air loop. The p-value of Total aerobic microbial count and Total Yeast and Mold Count was found to be 0.8685 and 0.8716 respectively. The result is not significant at p<0.05. The result of the Finger dab test was below 100 CFU/5 fingerprints in both hands and complies with the internal action limit.
Conclusion: The result of the study suggests that the higher load of organisms was found at the “near return loop area”. The result of the Finger dab test was satisfactory according to the in-house limit (100 CFU). The result can serve as a basis for selecting a sample spot for regular Environmental Monitoring in a Manufacturing Facility.
Keywords: Environment Monitoring Test, Near Return Air Loop, Clean rooms, Finger Dab Test
Article information
Introduction
The purpose of microbiological environmental monitoring is to assess the cleanliness of pharmaceutical (sterile and non-sterile) and medical device manufacturing environments. Environmental monitoring involves the collection of data relating to the numbers or incidents of microorganisms present on surfaces, in the air, and from people. [1]. The primary goal of environmental monitoring in cleanrooms is to regulate the numbers of airborne viable and non-viable particles within defined limits, predict the risk to the environment, and regularly assess the efficacy of cleaning and disinfecting processes [2].
Pharmaceutical manufacturing involves a complex, multi-phase processing system that is associated with significant risks of microbial contamination from various sources. The quality of the product is significantly influenced by microbial contamination in several processing steps [3]. To obtain a pharmaceutical product free of contamination, you need an adequate environmental monitoring system. The system includes identification, testing, and removal of bioburden to ensure the quality of the product [4].
Risk assessment approaches are used to determine the location of environmental monitoring [5]. Risk-based approaches include Failure Mode and Effects Analysis (FMEA), Fault Tree Analysis (FTA), Hazard Analysis and Critical Control Points (HACCP), and Quantitative Microbiological Risk Assessment (QMRA) [6,7]. The scope of this study is to fix the sampling spot based on risk assessment for performing environmental monitoring and to correlate the results of the Finger dab test and the non-viable count report with the sanitization of the area and the cleanliness of Personnel.
Method
Study Design
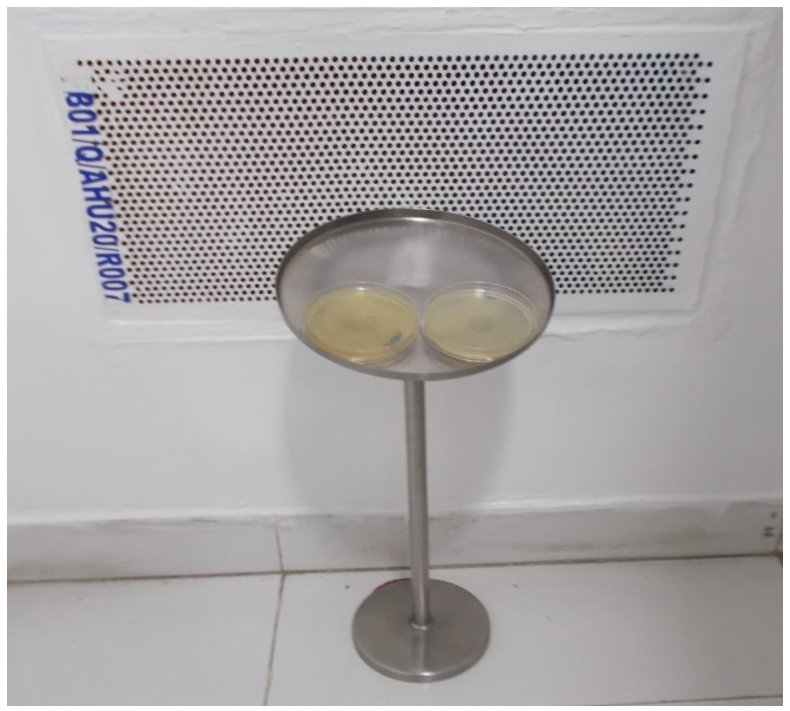
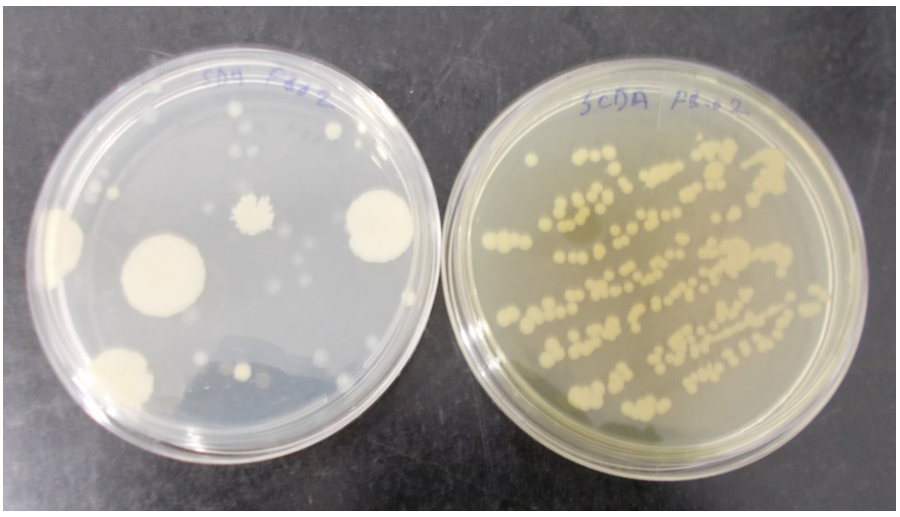
The study was designed as a cross-sectional pilot study and conducted between May 20 and 22, 2023. Test conditions were Dynamic and Temperature less (C), and Humidity () was maintained during study periods. Statistical analysis of the obtained data was done using the chi-square test, and the p-value was calculated. The test was performed by exposing 90 mm pre-sterilized Petri plates containing Soyabean Casein Digest Agar and Sabouraud Dextrose Agar at a height of 40 cm on the Petri plate stands for 4 hours at each location. After 4 hours of exposure time, the Petri plates were covered with a lid and transported to the Microbiology Lab aseptically in a closed container. Soybean Casein Digest Agar plates were incubated at 35 C for 72 hours, and Sabouraud Dextrose Agar Petri plates were incubated at 25 C for 5 days. The Equipment used during the study was well-calibrated, and a sterility check of the used media was done prior to conducting the test.
| S. No | Materials and Equipment | Manufacturer |
|---|---|---|
| 1 | Pre-sterilized Petri plates | Tarsons |
| 2 | Soyabean Casein Digest Agar (SCDA) | Hi Media |
| 3 | Sabouraud Dextrose Agar (SDA) | Hi Media |
| 4 | Hot Plate | Lab Quest |
| 5 | Autoclave | Equitron |
| 6 | Bio-safety Cabinet | Thermolab |
| 7 | Incubators | Allyone |
| 8 | Colony Counter | Lapiz |
| 9 | Stainless Steel Petri Plate Stand | Sanitt |
| 10 | 70% IPA | Qualigens |
SCDA, Soyabean Casein Digest Agar; SDA, Sabouraud Dextrose Agar; IPA, Isopropyl Alcohol.
| S. No | Sampling rooms | Sampling location in the Room |
|---|---|---|
| 1 | Dispensing Room | Near Machine |
| 2 | Granulation Room | Area with maximum man movement |
| 3 | Punching Room | Difficult to clean area |
| 4 | Coating Room | Near return air loop |
| 5 | Blister Packing | Near the Drainage area |
The Finger Dab test was performed in the Dispensing Room, Granulation Room, punching room, Coating room, and Blister Packing room by the personnel working in the respective areas. The in-house limit of the Finger Dab test was set at 100 CFU/5-finger print, as the production area was classified as a Class D area and non-sterile solid dosages were formulated in the area. Personnel working in areas were selected randomly, and the finger DAB test was evaluated for each of them. All the fingers, including the thumb of personnel’s gloves, were gently imprinted, and impressions of all these workers were obtained on labeled Petri plates containing Soyabean casein digest agar. All the plates were incubated at 35°C for 72 hours, and the results were recorded. The finger dab test in class D was proposed in a study to screen operator hygiene in non-sterile areas, and a 100 CFU in-house limit was selected as the internal action limit by analogy to the Class D Settle plate method. In the Class D area, the limit for the finger dab test is not defined in the WHO Technical Report Series No. 961. 2011, 100 CFU is an internal action limit, not a regulatory limit.
Procedure
25 plates of Soyabean Casein Digest Agar (SCDA) and 25 plates of Sabouraud Dextrose Agar (SDA) were exposed for 4 hours in all sampling points. The study was conducted for three successive days. Sterile Culture media plates of Soybean Casein Digest Agar and Sabouraud Dextrose Agar were exposed on Petri plates, placed at their respective sampling sites in each room, for four hours. After the completion of the exposure time, the Petri plates were aseptically transported to the Microbiology laboratory. Soybean Casein Digest Agar plates were incubated in an incubator for 72 hours, and Sabouraud Dextrose Agar Petri plates were incubated in a Biological Oxygen Demand (BOD) Incubator for 5-7 days. After the completion of the incubation period, colonies on Petri plates were counted using a Colony Counter, and the results were interpreted.
Result
Microbial count in different areas
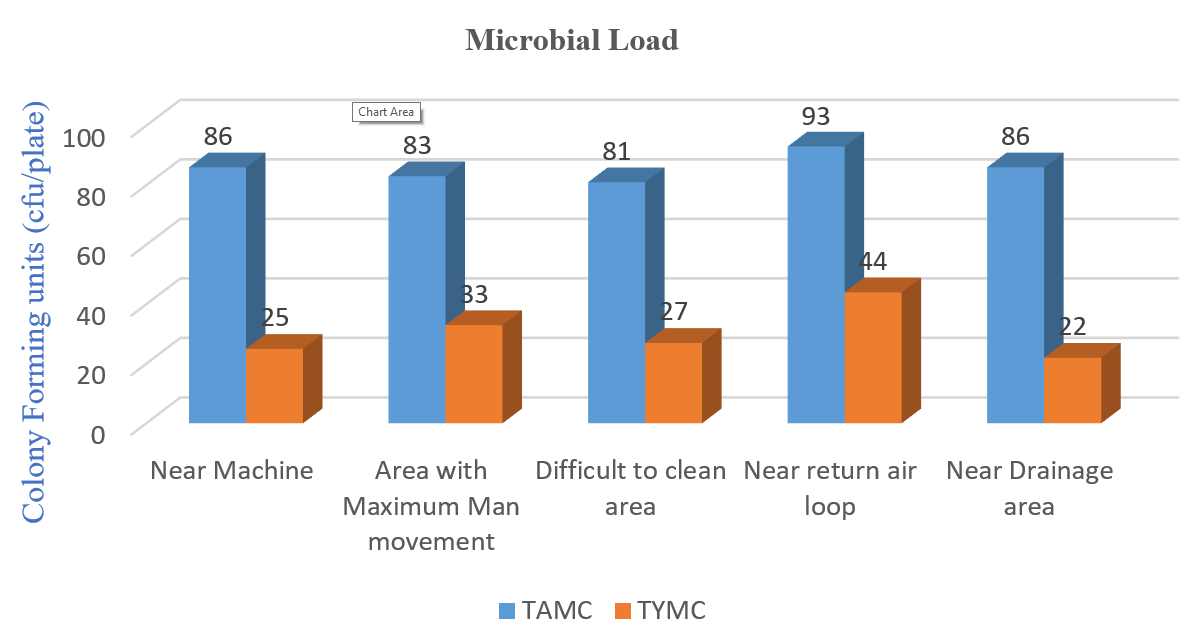
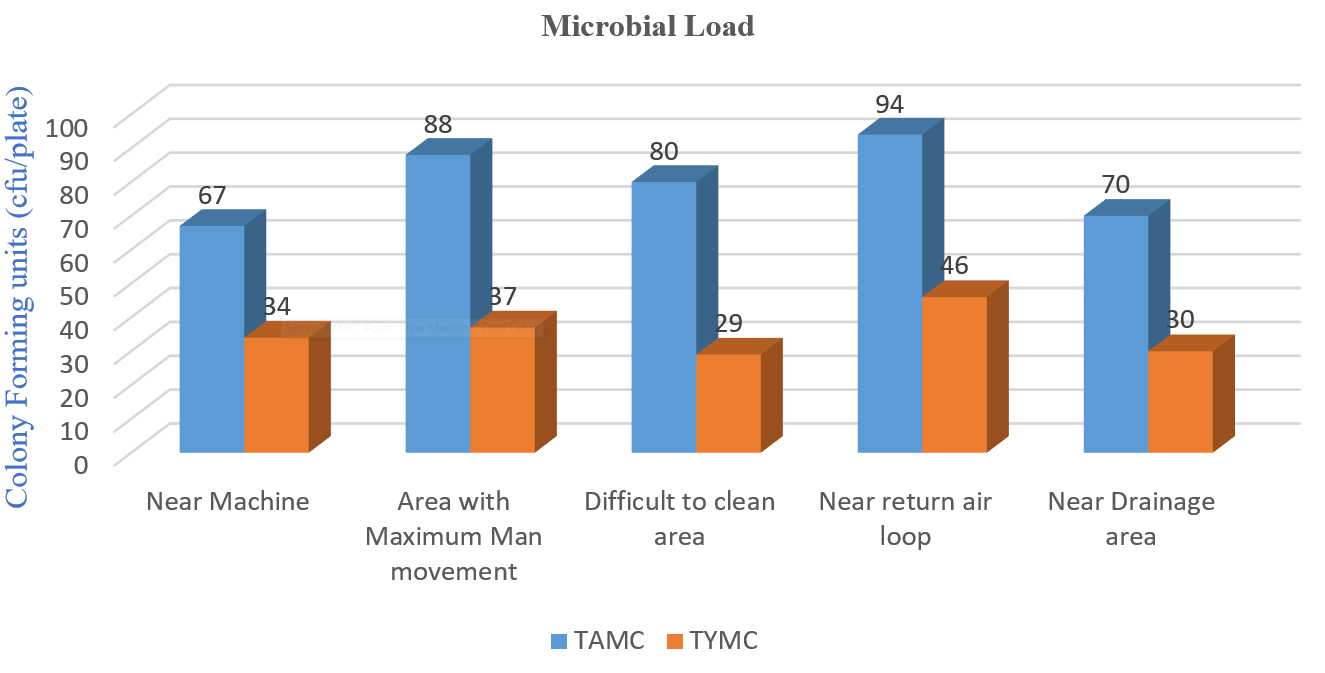
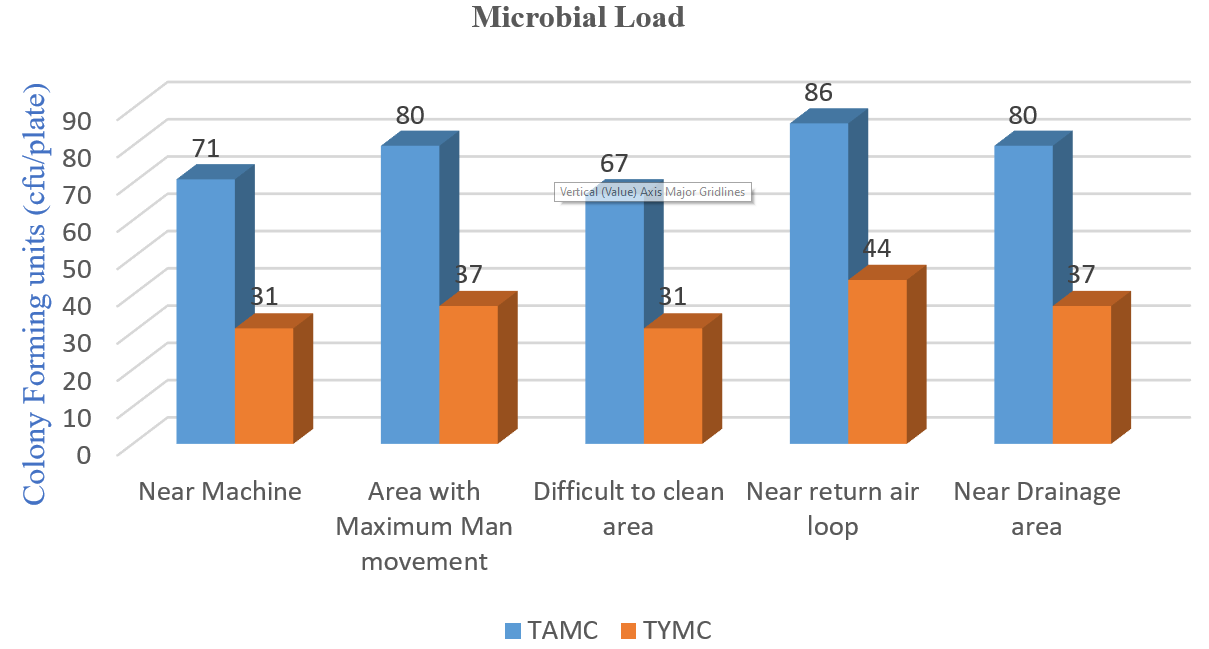
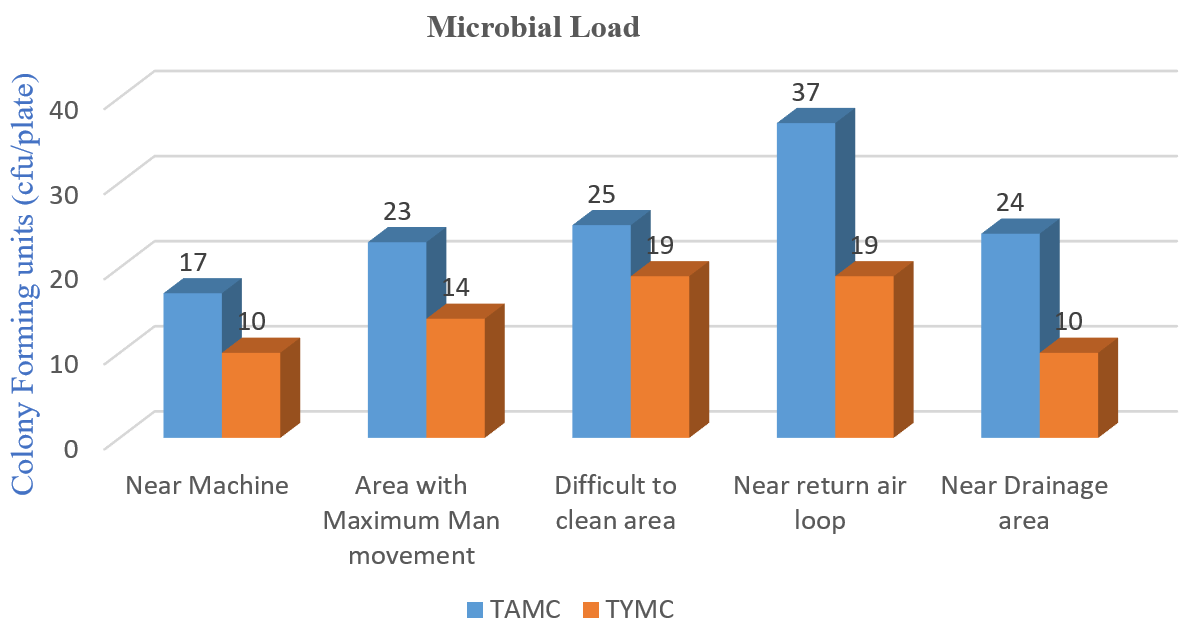
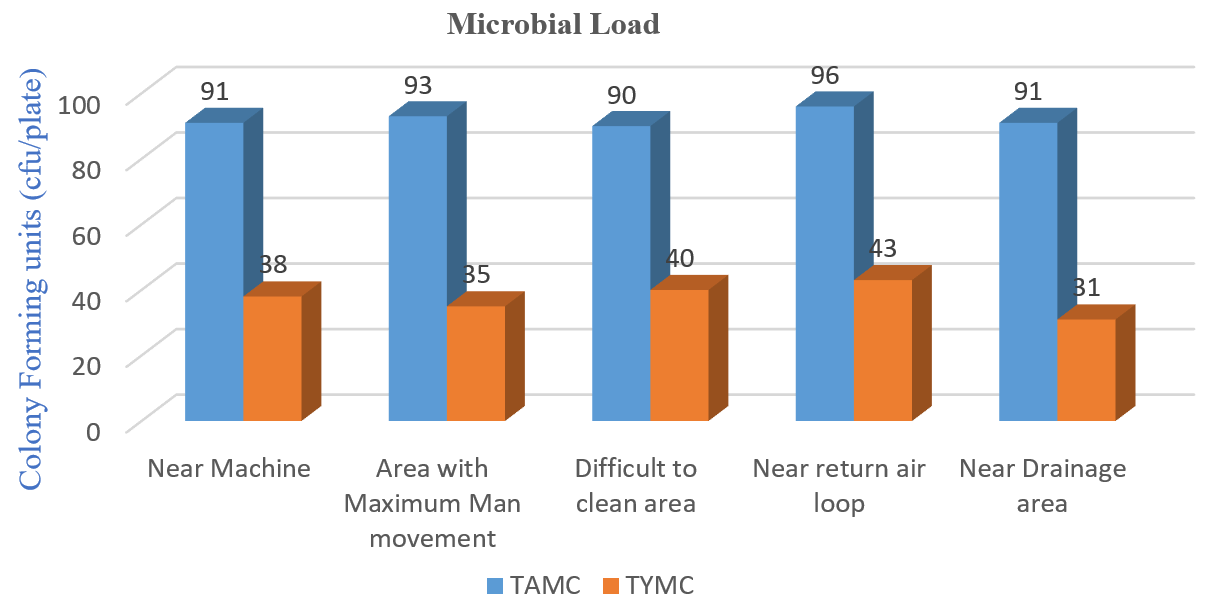
The results obtained for the different locations of five rooms were counted, and the mean CFU was calculated for each sample location and sampling point within the room. The obtained data suggest that a higher Microbial load was observed in the “Near Return Air Loop” sample spot in each room. The higher count near the return loop warrants a study of grill cleanliness, personal proximity, and equipment, as well as heat plumes around the return filters. The p-value of Total aerobic microbial count was 0.8685, and the p-value of Total Yeast and Mold Count was 0.8716. The result is not significant at p<0.05.
| S. No | Sampling Location | Total Aerobic Microbial Count (CFU/Plate) | Total Yeast and Mold Count (CFU/Plate) | ||||||
|---|---|---|---|---|---|---|---|---|---|
| Day-I | Day-II | Day-III | Mean | Day-I | Day-II | Day-III | Mean | ||
| 1 | Near Machine | 84 | 90 | 84 | 86 | 21 | 28 | 26 | 25 |
| 2 | Area with maximum man movement | 92 | 75 | 82 | 83 | 30 | 31 | 38 | 33 |
| 3 | Difficult to clean area | 84 | 81 | 78 | 81 | 24 | 26 | 31 | 27 |
| 4 | Near return air loop | 96 | 93 | 90 | 93 | 43 | 47 | 42 | 44 |
| 5 | Near the Drainage area | 91 | 77 | 90 | 86 | 16 | 26 | 24 | 22 |
CFU, Colony Forming Units.
| S. No | Sampling Location | Total Aerobic Microbial Count (CFU/Plate) | Total Yeast and Mold Count (CFU/Plate) | ||||||
|---|---|---|---|---|---|---|---|---|---|
| Day-I | Day-II | Day-III | Mean | Day-I | Day-II | Day-III | Mean | ||
| 1 | Near Machine | 65 | 67 | 69 | 67 | 32 | 36 | 34 | 34 |
| 2 | Area with maximum man movement | 85 | 89 | 90 | 88 | 33 | 39 | 39 | 37 |
| 3 | Difficult to clean area | 80 | 76 | 84 | 80 | 26 | 31 | 30 | 29 |
| 4 | Near return air loop | 90 | 94 | 98 | 94 | 45 | 45 | 48 | 46 |
| 5 | Near the Drainage area | 75 | 65 | 70 | 70 | 32 | 25 | 33 | 30 |
CFU, Colony Forming Units.
| S. No | Sampling Location | Total Aerobic Microbial Count (CFU/Plate) | Total Yeast and Mold Count (CFU/Plate) | ||||||
|---|---|---|---|---|---|---|---|---|---|
| Day-I | Day-II | Day-III | Mean | Day-I | Day-II | Day-III | Mean | ||
| 1 | Near Machine | 74 | 71 | 68 | 71 | 25 | 32 | 36 | 31 |
| 2 | Area with maximum man movement | 82 | 78 | 80 | 80 | 38 | 33 | 40 | 37 |
| 3 | Difficult to clean area | 65 | 67 | 69 | 67 | 26 | 35 | 32 | 31 |
| 4 | Near return air loop | 84 | 86 | 88 | 86 | 46 | 42 | 44 | 44 |
| 5 | Near Drainage area | 80 | 78 | 82 | 80 | 37 | 40 | 34 | 37 |
CFU, Colony Forming Units.
| S. No | Sampling Location | Total Aerobic Microbial Count (CFU/Plate) | Total Yeast and Mold Count (CFU/Plate) | ||||||
|---|---|---|---|---|---|---|---|---|---|
| Day-I | Day-II | Day-III | Mean | Day-I | Day-II | Day-III | Mean | ||
| 1 | Near Machine | 17 | 12 | 22 | 17 | 11 | 10 | 9 | 10 |
| 2 | Area with maximum man movement | 23 | 26 | 20 | 23 | 12 | 14 | 16 | 14 |
| 3 | Difficult to clean area | 31 | 24 | 20 | 25 | 17 | 17 | 23 | 19 |
| 4 | Near return air loop | 34 | 37 | 40 | 37 | 14 | 18 | 28 | 20 |
| 5 | Near the Drainage area | 21 | 29 | 22 | 24 | 7 | 10 | 13 | 10 |
CFU, Colony Forming Units.
| S. No | Sampling Location | Total Aerobic Microbial Count (CFU/Plate) | Total Yeast and Mold Count (CFU/Plate) | ||||||
|---|---|---|---|---|---|---|---|---|---|
| Day-I | Day-II | Day-III | Mean | Day-I | Day-II | Day-III | Mean | ||
| 1 | Near Machine | 90 | 95 | 88 | 91 | 36 | 37 | 41 | 38 |
| 2 | Area with maximum man movement | 95 | 94 | 90 | 93 | 40 | 35 | 30 | 35 |
| 3 | Difficult to clean area | 95 | 96 | 97 | 96 | 42 | 40 | 38 | 40 |
| 4 | Near return air loop | 90 | 88 | 92 | 90 | 42 | 45 | 42 | 43 |
| 5 | Near Drainage area | 90 | 93 | 90 | 91 | 38 | 40 | 22 | 31 |
CFU, Colony Forming Units.
| Room | Near Machine | Area with maximum Mean value | Difficult to clean area | Near return air loop | Near the Drainage area | Row Total |
|---|---|---|---|---|---|---|
| Dispensing room | 86 (79.17) (0.59) | 83 (87.53) (0.23) | 81 (81.79) (0.01)* | 93 (96.82) (0.15) | 86 (83.70) (0.06) | 429 |
| Granulation room | 67 (73.63) (0.60) | 88 (81.40) (0.54) | 80 (90.05) (0.17) | 94 (90.05) (0.17) | 70 (77.85) (0.79) | 399 |
| Punching room | 71 (70.87) (0.00)* | 80 (78.38) (0.04)* | 67 (86.66) (0.01)* | 86 (86.66) (0.01)* | 80 (74.92) (0.34) | 384 |
| Coating room | 17 (23.25) (1.68) | 23 (25.70) (0.28) | 25 (24.02) (0.04)* | 37 (28.44) (2.58) | 24 (24.58) (0.01)* | 126 |
| Blister packing room | 91 (85.08) (0.41) | 93 (94.05) (0.01)* | 90 (87.89) (0.05) | 96 (104.04) (0.62) | 91 (89.94) (0.01)* | 461 |
| Column total | 332 | 367 | 343 | 406 | 351 | 1779 |
(*) Statistically Significant. P-value: 0.8685. The result is not significant at p<0.05
| Room | Near Machine | Area with maximum Mean value | Difficult to clean area | Near return air loop | Near the Drainage area | Row Total |
|---|---|---|---|---|---|---|
| Dispensing room | 23 (26.49) (0.46) | 33 (30.38) (0.23) | 27 (28.44) (0.07) | 44 (38.37) (0.83) | 22 (25.32) (0.44) | 149 |
| Granulation room | 34 (31.29) (0.23) | 37 (35.89) (0.03)* | 29 (33.59) (0.63) | 46 (45.32) (0.01)* | 30 (29.91) (0.00)* | 176 |
| Punching room | 31 (32.00) (0.03)* | 37 (36.71) (0.00)* | 31 (34.35) (0.33) | 44 (46.35) (0.12) | 37 (30.59) (1.34) | 180 |
| Coating room | 10 (12.98) (0.68) | 14 (14.89) (0.05) | 19 (13.93) (1.84) | 20 (18.80) (0.08) | 10 (12.41) (0.47) | 73 |
| Blister packing room | 38 (33.24) (0.68) | 35 (38.13) (0.26) | 40 (35.69) (0.52) | 43 (48.16) (0.55) | 31 (31.78) (0.02)* | 187 |
| Column total | 136 | 156 | 146 | 197 | 130 | 765 |
(*) Statistically Significant. P-value: 0.8716. The result is not significant at p<0.05.
| Grade | Air Sample (CFU/m 3 ) | 90 mm Diameter Settle Plates (CFU/4 hours) | 55 mm Diameter Contact Plates (CFU/plate) | Gloves Print (5 fingers) CFU/Glove |
|---|---|---|---|---|
| Class A | <1 | <1 | <1 | <1 |
| Class B | 10 | 5 | 5 | 5 |
| Class C | 100 | 50 | 25 | - |
| Class D | 200 | 100 | 50 | - |
CFU, Colony Forming Units.
| S. No. | Sample Code No. | Sampling Location | TAMC (Right Hand, CFU/Plate) | TAMC (Left Hand, CFU/Plate) |
|---|---|---|---|---|
| 1 | 09 | Dispensing Room | 30 | 22 |
| 2 | 19 | Dispensing Room | 47 | 29 |
| 3 | 24 | Granulation Room | 24 | 48 |
| 4 | 51 | Granulation Room | 30 | 41 |
| 5 | 62 | Punching Room | 58 | 48 |
| 6 | 28 | Punching Room | 59 | 48 |
| 7 | 42 | Coating Room | 46 | 47 |
| 8 | 11 | Coating Room | 58 | 45 |
| 9 | 36 | Blister Packing Room | 32 | 30 |
TAMC, Total Aerobic Microbial Count; CFU, Colony Forming Units.
The result of a higher count near the return air loop may be due to the airflow path. The result aligns with a similar study by Shrawan et al. (2025), who reported a higher load at the return loop [8]. The Finger Dab test was conducted in the Class D area to screen operator hygiene in a non-sterile environment, with a limit of 100 CFU/5 fingerprints, as the internal action level was selected as a limit in analogy to the Class D Settle plate method, but not a regulatory limit.
The result was satisfactory, but the study warrants consideration of whether it can be done or not, as no guidelines suggest the finger dab test in a Class D area.
Discussion and Conclusion
The result of the study suggests that the pharmaceutical industry is operating in compliance with the standard for viable particles. Although the study is a single-site pilot study, all viable counts were within expectation for Class D. Seasonal variability and inter-site comparability study remain the major aspects to be concluded in further studies. So far, the results of the viable count of microorganisms indicate that higher counts are found near the Return loop areas. This result can serve as a basis for selecting the sample spot for the regular environmental monitoring Program in Class D areas of the pharmaceutical industry. Operator hygiene should be considered at higher Personnel Proximity in a Pharmaceutical Manufacturing Facility. Although 100 CFU/5 fingerprint is not a regulatory limit, it can be considered an internal action limit to maintain hygiene within a Class D pharmaceutical manufacturing facility.
Conflicts of Interest
The authors declare that they have no competing interests that could have influenced the objectivity or outcome of this research.
Funding Source
This research did not receive any specific grant from funding agencies in the public, commercial, or non-profit sectors.
Acknowledgments
Thank you, Dr. Kamlesh Dutta, for your everlasting support during the study period.
Institutional Review Board (IRB)
This study did not involve human participants, human data, or human tissue. Therefore, approval from an IRB or ethics committee was not required. All procedures were conducted in accordance with the relevant guidelines and regulations for laboratory-based research.
Large Language Model
No large language model was used in the preparation of this manuscript.
Authors Contribution
SKS contributed to conceptualization, methodology, investigation, data collection, analysis, and writing of the original draft and final manuscript.
Data Availability
No datasets were generated or analyzed for this study beyond the summary results presented in the article; therefore, no additional data are available. Data sharing does not apply to this research. For reasonable queries about the summarized results or methods, please contact the corresponding author listed in the manuscript.
References
- Sandle Tim, Tidswell Ward, Saghee Madhu Raju. Microbiology and sterility assurance in pharmaceuticals and medical devices. 2011.
- World Health Organization. WHO good manufacturing practices for sterile pharmaceutical products. 2011.
- Ratajczak M., Kubicka M. M., Kaminska D., Sawicka P., Dlugaszewska J.. Microbiological quality of non-sterile pharmaceutical products. Saudi Pharm J. 2015;23(3):303-7. doi:10.1016/j.jsps.2014.11.015 PMID: 26106278 PMCID: PMC4475860
- Mehdi Azam, Mehmood Muhammad, Usman Ghani Muhammad, Ismail Muhammad, Ameen Faisal. Environmental Monitoring and Risk Assessment of Cleanrooms within Pharmaceutical Industry. International Journal of Pharmacy. 2018;8:38-69.
- Sandle Tim. The use of a risk assessment in the pharmaceutical industry – the application of FMEA to a sterility testing isolator: a case study. European Journal of Parenteral and Pharmaceutical Sciences. 2003;8(2):43-49.
- Whyte W, Eaton T. Microbial risk assessment in pharmaceutical cleanrooms. European Journal of Parenteral and Pharmaceutical Sciences. 2004;9(1):16-23.
- Whyte W, Eaton T. Microbiological contamination models for use in risk assessment during pharmaceutical production. European Journal of Parenteral and Pharmaceutical Sciences. 2004;9(1):11-15.
- Singh Shrawan Kr, Dutta Kamlesh, Chaudhary Ravi. Risk Based Study of Sample Spot Fixing for Conducting Environmental Monitoring Test in Classified Areas of Pharmaceutical Industry. Int. J. of Pharm. Sci.. 2025;3(2):146-152. doi:10.5281/zenodo.14793799