Trends in Mortality Involving Ischemic Heart Disease and Procedure-related Conditions in U.S. Adults, 1999–2023
Mohamed AlatfawyⒾ1, Youssef RamadanⒾ2*, Abdelrhman H. MohamedⒾ3, Maryam SaghirⒾ4, Alyaa Ahmed IbrahimⒾ5, Anika GoelⒾ6, Waheed QaisiⒾ7, Krish PatelⒾ8, Mostafa Mohamed Abdelmoneam ElsawyⒾ2, Omar Khaled ElsalhyⒾ2, Ibtissam ElGhazzaniⒾ9, Sihame ElGhazzaniⒾ9, Alaa EldeebⒾ5, Walid BechibchiⒾ10, Mohamed Fawzi HemidaⒾ5
- 1Faculty of Medicine, Kafrelsheikh University, Kafr Elsheikh, Egypt
- 2Faculty of Medicine, October 6 University, Giza, Egypt
- 3Faculty of Medicine, Luxor University, Luxor, Egypt
- 4Jinnah Sindh Medical University, Karachi, Pakistan
- 5Faculty of Medicine, Alexandria University, Alexandria, Egypt
- 6Kakatiya Medical College, Warangal, Telangana, India
- 7An-Najah National University, Nablus, Palestine
- 8C. U. Shah Medical College, Surendranagar, Gujarat, India
- 9Faculty of Medicine of Tunis, University of Tunis El Manar, Tunis, Tunisia
- 10Faculty of Medicine, University of Constantine 3 Salah Boubnider, Constantine, Algeria
Abstract
Background: Ischemic heart disease (IHD) is a leading cause of death in the United States, and death certificates may contain medical or surgical care-related codes among decedents with IHD. However, these codes do not establish procedural exposure, postoperative status, timing, or causality. This study assesses 25-year trends in mortality involving IHD and Y83–Y84 codes.
Methods: Nationwide multiple-cause-of-death (MCOD) death-certificate records were obtained from the CDC WONDER database for U.S. adults aged ≥25 years from 1999–2023. Death records containing IHD (ICD-10 codes I20–I25) and medical/surgical care-related codes (Y83–Y84) were identified. We calculated age-adjusted mortality rates (AAMRs) per 100,000 people in the general U.S. population. We used joinpoint regression to estimate annual percentage changes (APCs) and average annual percentage changes (AAPCs).
Results: From 1999–2023, a total of 144,644 deaths were reported. The AAMR significantly decreased from 4.19 in 1999 to 1.13 in 2023 (AAPC: -5.51; p = 0.000021). The overall AAMR was 3.78 (AAPC: -5.26) among males and 1.71 (AAPC: -6.12) among females. By race, AAMRs declined substantially among all groups from 1999 to 2023, with the highest 1999 AAMR observed among NH White individuals (4.35). Regionally, the Midwest had the highest overall AAMR (2.75). Adults aged ≥65 years had the highest overall CMR (10.34). From 1999 to 2020, the population-level AAMR was 3.21 in nonmetropolitan areas and 2.45 in metropolitan areas.
Conclusions: Mortality involving IHD and medical/surgical procedure-related codes declined in recent years, particularly during 2021–2023. Higher population-level mortality rates were observed among males and in the Midwest region.
Keywords: Ischemic heart disease, Procedure-related mortality, Mortality trends, CDC WONDER, Epidemiology
Article information
Introduction
Ischemic heart disease (IHD), commonly referred to as coronary artery disease (CAD) or coronary heart disease, continues to represent one of the most significant public health challenges in the United States, remaining the leading cause of mortality and morbidity among adults. Recent nationally representative survey data indicate that CAD affects approximately 4.9% of U.S. adults, with slightly higher rates in men and markedly increasing prevalence with age. This translates to millions of Americans living with clinically diagnosed CAD, and the burden is disproportionately greater among older individuals and male adults, underscoring persistent demographic disparities [1,2]. IHD accounts for more than one in seven deaths in the United States, with coronary heart disease specifically responsible for over 371,000 deaths annually [3]. Despite advances in medical and interventional therapies, projections suggest that the prevalence of IHD will continue to rise, with estimates indicating a potential 31% increase by 2060, largely attributed to population aging and persistent risk factors including diabetes, hypertension, and dyslipidemia [4].
Patients with IHD represent a particularly vulnerable population in the context of medical and surgical procedures, facing substantially elevated risks compared to those without cardiac disease. Studies demonstrate that patients with significant cardiac disease who undergo vascular or major surgery may face up to a 10% risk of major morbidity and mortality. However, these findings from clinical surgical cohorts should be distinguished from death-certificate data containing medical/surgical procedure-related codes, which cannot establish whether a procedure occurred, the timing of the procedure, postoperative status, or a causal relationship between the procedure-related condition and death [5,6]. Postoperative myocardial injuries and infarction occur in approximately 18–20% of patients undergoing noncardiac surgery, with peak incidence within the first 48 hours postoperatively [7,8]. The pathophysiology underlying increased risk associated with medical and surgical procedures involves multiple mechanisms, including increased myocardial oxygen demand during procedural stress, hemodynamic fluctuations, and prothrombotic states [9,10]. Advanced age, emergency surgery, and multiple comorbidities further amplify the risk of adverse postoperative outcomes in this population [11].
While substantial attention has been directed toward understanding cardiac risk associated with medical and surgical procedures in patients with IHD, comprehensive long-term population-level analyses of mortality involving IHD and medical/surgical procedure-related codes remain limited. Most existing studies have focused on short-term outcomes or specific surgical procedures, leaving a gap in understanding how mortality involving IHD and medical/surgical procedure-related codes has evolved over extended periods. In the U.S. Multiple Cause of Death (MCOD) database, procedure-related conditions identify death records in which medical or surgical care was documented; however, these records do not establish the timing of the procedure relative to IHD or death or confirm a causal relationship. The changing landscape of cardiac care suggests that mortality trends may have shifted considerably. Yet, the magnitude of these changes and potential disparities across demographic and geographic subgroups have not been systematically characterized. This study examines 25-year trends in mortality records involving IHD and medical/surgical procedure-related codes among U.S. adults aged 25 years.
Methods
Study setting and population
In this descriptive study, we analyzed national mortality trends using MCOD records from the Centers for Disease Control and Prevention Wide-Ranging Online Data for Epidemiologic Research (CDC WONDER) database for U.S. adults aged 25 years from 1999 to 2023, as shown in a previous CDC study [12]. We identified IHD using ICD-10 codes I20–I25, and medical/surgical procedure-related events using Y83–Y84 [13,14]. We identified both code groups regardless of their position on the death certificate, and included records containing both I20–I25 and Y83–Y84. Thus, the analysis identified death certificates documenting both IHD and medical/surgical procedure-related codes rather than a clinically defined postoperative cohort. Deaths among individuals younger than 25 years and records without both coding criteria were excluded. Because MCOD data are based on death certificates, we could not establish the timing of the procedure relative to IHD or death, or any causal relationship. Institutional review board approval was not required because the study used publicly available, de-identified mortality data. The study was reported in accordance with the Strengthening the Reporting of Observational Studies in Epidemiology (STROBE) guidelines [15].
Outcome definition
The primary outcome was defined as mortality records documenting both IHD and medical/surgical procedure-related conditions on the death certificate. This outcome represents deaths in which IHD and procedure-related conditions were concurrently documented and should not be interpreted as confirmed postoperative deaths or as evidence that a medical or surgical procedure caused the death.
Data abstraction
We extracted data on population size, year, and demographic characteristics, including sex, age, race and ethnicity, and region. We classified racial and ethnic categories as non-Hispanic (NH) White, NH Black or African American, Hispanic or Latino, NH American Indian or Alaska Native, and NH Asian or Pacific Islander. Mortality estimates for NH American Indian or Alaska Native individuals were suppressed when counts were too small to produce reliable estimates and were therefore not interpreted. The National Center for Health Statistics (NCHS) 2013 Urban-Rural Classification Scheme classified counties as metropolitan or nonmetropolitan [16,17]. Metropolitan counties included large central metropolitan, large fringe metropolitan, medium metropolitan, and small metropolitan counties, whereas nonmetropolitan counties included micropolitan and noncore counties. Because CDC WONDER provided urban-rural classification data through 2020, we restricted the urban-rural analysis to 1999–2020. We stratified regions into Northeast, Midwest, South, and West according to U.S. Census Bureau definitions. We categorized age groups as 25–44 years, 45–64 years, and 65 years.
Statistical analysis
We calculated crude mortality rates (CMRs) and age-adjusted mortality rates (AAMRs) per 100,000 population from 1999 to 2023. We stratified them by year, sex, and race/ethnicity, with urban-rural analyses restricted to 1999–2020. We standardized AAMRs to the 2000 U.S. standard population across all age groups, with corresponding 95% confidence intervals (CIs) [18]. We calculated CMRs by dividing the number of deaths involving IHD and medical/surgical procedure-related codes by the corresponding U.S. population for each year and expressed them per 100,000 population. We used age-specific CMRs for age-stratified analyses, as age adjustment is unnecessary within defined age strata. To quantify national annual trends in mortality involving IHD and medical/surgical procedure-related codes, we used the Joinpoint Regression Program (version 5.4.0.0, National Cancer Institute) to estimate the Annual Percentage Change (APC) and Average Annual Percentage Change (AAPC) with 95% CIs [19]. We fit log-linear regression models (ln(y) transformation of rates) to model temporal variation. We permitted a maximum of 4 joinpoints. Model selection was conducted using the Permutation Test with a statistical significance threshold of alpha = 0.05 and 4,499 permutations. We specified standard errors using the standard errors provided in the CDC WONDER rate estimates (heteroscedastic error specification). We assumed errors were uncorrelated over time. Confidence intervals for APCs and AAPCs were calculated using the Empirical Quantile method with 5,001 resamples.
We conducted subgroup analyses across prespecified demographic and geographic categories. We did not perform sensitivity analyses for sparse strata; therefore, we interpreted estimates based on small cell counts cautiously because of potential statistical instability. We considered APCs increasing or decreasing if the slope describing the change in mortality differed significantly from zero using a two-tailed t-test (p < 0.05).
Results
Overall trends
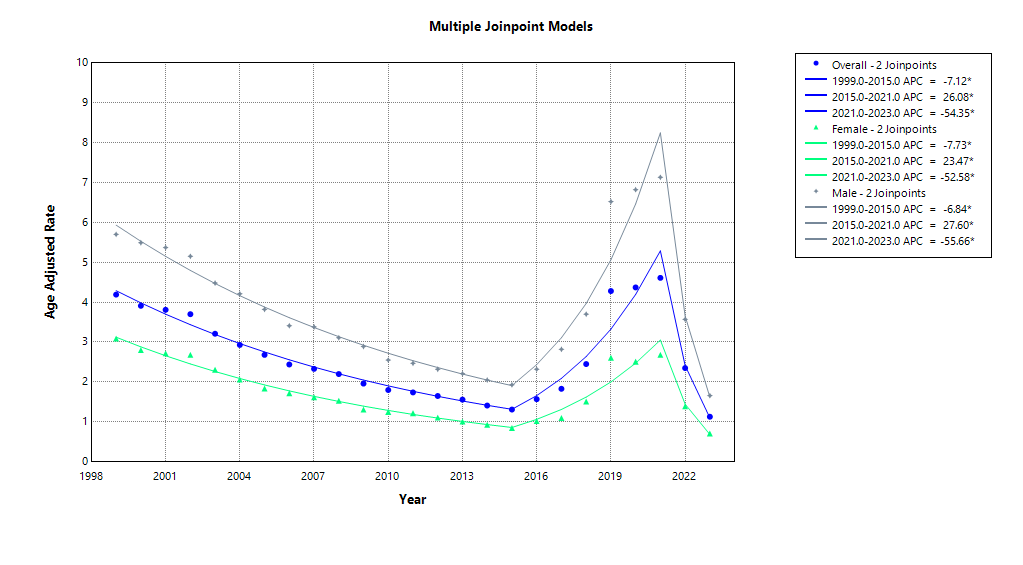
Between 1999 and 2023, a total of 144,644 deaths in the United States were identified in mortality records documenting both IHD and medical/surgical procedure-related conditions. Overall, AAMR declined from 4.19 (95% CI: 4.1 to 4.29) in 1999 to 1.13 (95% CI: 1.09 to 1.17) in 2023, with an AAPC of -5.51 (95% CI: -7.94 to -3.01) (p = 0.000021), thus reflecting a downward trend.
From 1999 to 2015, the AAMR declined from 4.19 (95% CI: 4.10–4.29) to 1.31 (95% CI: 1.26–1.36), with an APC of -7.12 (95% CI: -8.04 to -6.18; p < 0.000001). From 2015 to 2021, the AAMR increased again, increasing from 1.31 (95% CI: 1.26–1.36) to 4.61 (95% CI: 4.53–4.70) in 2021, with an APC of 26.08 (95% CI: 19.33 to 33.22; p < 0.000001). From 2021 to 2023, the AAMR declined from 4.61 (95% CI: 4.53–4.70) to 1.13 (95% CI: 1.09–1.17), with an APC of -54.35 (95% CI: -65.58 to -39.46; p = 0.000019) (Figure Figure 1; Supplemental Tables 1, 2, 3).
Trends by sex
When stratified by sex, males accounted for more deaths than females among records documenting both IHD and medical/surgical procedure-related conditions. (90,561 deaths in males vs. 54,083 deaths in females). In males, the AAMR decreased from 5.7 (95% CI: 5.53 to 5.88) in 1999 to 1.66 (95% CI: 1.59 to 1.74) in 2023, yielding an AAPC of -5.26 (95% CI: -7.63 to -2.84; p = 0.000028). The AAMR also exhibited an overall downward trend in females, decreasing from 3.09 (95% CI: 2.98 to 3.19) in 1999 to 0.71 (95% CI: 0.67 to 0.76) in 2023. The AAPC for this period was -6.12 (95% CI: -8.81 to -3.35; p = 0.000021).
Among males, the AAMR declined from 5.7 (95% CI: 5.53 to 5.88) in 1999 to 1.93 (95% CI: 1.85–2.02) in 2015; this reduction yielded an APC of -6.84 (95% CI: -7.76 to -5.91; p < 0.000001). From 2015 to 2021, the AAMR increased from 1.93 (95% CI: 1.85–2.02) in 2015 to 7.13 (95% CI: 6.98–7.29) in 2021, with an APC of 27.60 (95% CI: 21.58 to 33.92; p < 0.000001). From 2021 to 2023, the AAMR trended downward, decreasing from 7.13 (95% CI: 6.98–7.29) in 2021 to 1.66 (95% CI: 1.59–1.74) in 2023, with an APC of -55.66 (95% CI: -66.55 to -41.23; p = 0.000012).
Among females, the AAMR also exhibited a similar downward trend during a similar time frame, decreasing from 3.09 (95% CI: 2.98–3.19) in 1999 to 0.85 (95% CI: 0.80–0.90) in 2015, with an APC of -7.73 (95% CI: -8.73 to -6.73; p < 0.000001). From 2015 to 2021, AAMR increased from 0.85 (95% CI: 0.80–0.90) in 2015 to 2.68 (95% CI: 2.60–2.77) in 2021, with an APC of 23.47 (95% CI: 16.04 to 31.36; p = 0.000002). From 2021 to 2023, the AAMR trended downward, decreasing from 2.68 (95% CI: 2.60–2.77) in 2021 to 0.71 (95% CI: 0.67–0.76) in 2023, with an APC of -52.58 (95% CI: -65.40 to -35.0; p = 0.000111) (Figure Figure 1; Supplemental Tables 1, 2, 3).
Trends by race and ethnicity
Across the study period, NH White individuals accounted for the highest number of deaths (116,083 deaths), followed by NH Black/African American individuals (13,891 deaths), Hispanics (9,623 deaths), NH Asian or Pacific Islander (4,120 deaths), and NH American Indian or Alaska Native (927 deaths).
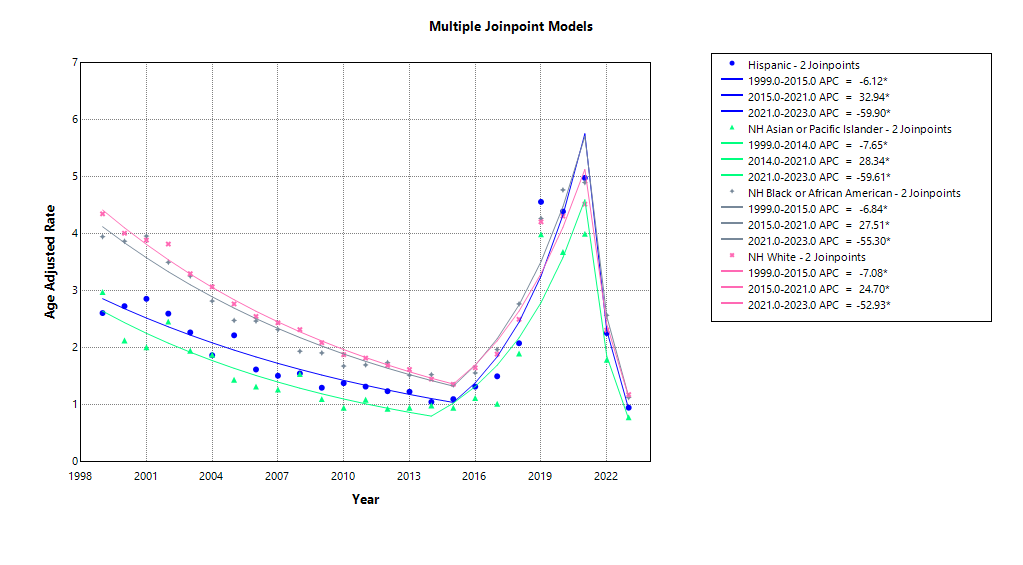
Among NH White individuals, the AAMR decreased from 4.35 (95% CI: 4.24 to 4.45) in 1999 to 1.18 (95% CI: 1.13 to 1.23) in 2023. Consequently, the AAPC was -5.50 (95% CI: -7.38 to -3.59; p < 0.000001). From 1999 to 2015, the AAMR decreased from 4.35 (95% CI: 4.24 to 4.45) in 1999 to 1.36 (95% CI: 1.30–1.41) in 2015, resulting in an APC of -7.08 (95% CI: -7.83 to -6.32; p < 0.000001). Then, the AAMR increased from 1.36 (95% CI: 1.30–1.41) in 2015 to 4.52 (95% CI: 4.42–4.61) in 2021, yielding an APC of 24.70 (95% CI: 19.17 to 30.49; p < 0.000001). This was followed by a downward trend, with the AAMR decreasing from 4.52 (95% CI: 4.42–4.61) in 2021 to 1.18 (95% CI: 1.13–1.23) in 2023, resulting in an APC of -52.93 (95% CI: -61.87 to -41.89; p = 0.000001).
Among NH Black/African American individuals, the AAMR decreased from 3.95 (95% CI: 3.63 to 4.27) in 1999 to 1.13 (95% CI: 1.00 to 1.26) in 2023, with an AAPC of -5.22 (95% CI: -7.42 to -2.96; p = 0.000008). From 1999 to 2015, the AAMR demonstrated a downward trend, decreasing from 3.95 (95% CI: 3.63 to 4.27) in 1999 to 1.35 (95% CI: 1.20–1.50) in 2015, and thus giving an APC of -6.84 (95% CI: -7.7 to -5.97; p < 0.000001). Then, from 2015 to 2021, the AAMR increased significantly, from 1.35 (95% CI: 1.20–1.50) in 2015 to 4.9 (95% CI: 4.63–5.18) in 2021. An APC of 27.51 (95% CI: 21.96 to 33.32; p < 0.000001) was recorded for that time frame. However, from 2021 to 2023, the AAMR decreased from 4.9 (95% CI: 4.63–5.18) in 2021 to 1.13 (95% CI: 1.00–1.26) in 2023, with an APC of -55.3 (95% CI: -65.61 to -41.90; p = 0.000006).
Among Hispanics, the AAMR also decreased, as noted in other demographics, decreasing from 2.61 (95% CI: 2.26 to 2.95) in 1999 to 0.95 (95% CI: 0.83 to 1.06) in 2023; the AAPC was -4.6 (95% CI: -8.53 to -0.5; p = 0.028). From 1999 to 2015, the AAMR decreased from 2.61 (95% CI: 2.26–2.95) in 1999 to 1.10 (95% CI: 0.96–1.25) in 2015, with an APC of -6.12 (95% CI: -8.18 to -4.01; p = 0.000014). Furthermore, from 2015 to 2021, the AAMR demonstrated a significant increase, trending from 1.10 (95% CI: 0.96–1.25) in 2015 to 4.98 (95% CI: 4.70–5.26) in 2021, with an APC of 32.94 (95% CI: 22.33 to 44.47; p = 0.000001). Then, from 2021 to 2023, the AAMR decreased significantly, from 4.98 (95% CI: 4.70–5.26) in 2021 to 0.95 (95% CI: 0.83–1.06) in 2023, recording an APC of -59.90 (95% CI: -74.40 to -37.18; p = 0.000491) for that time frame.
Among NH Asian/Pacific Islander individuals, the AAMR decreased from 2.98 (95% CI: 2.44 to 3.53) in 1999 to 0.78 (95% CI: 0.64 to 0.92) in 2023, with an AAPC of -5.11 (95% CI: -9.84 to -0.14; p = 0.000042). From 1999 to 2014, the AAMR demonstrated a downward trend, decreasing from 2.98 (95% CI: 2.44 to 3.53) in 1999 to 0.99 (95% CI: 0.80–1.19) in 2014, and thus giving an APC of -7.65 (95% CI: -10.44 to -4.76; p = 0.000042). Then, from 2014 to 2021, the AAMR increased significantly, reaching from 0.99 (95% CI: 0.80–1.19) in 2014 to 4 (95% CI: 3.66–4.34) in 2021, with an APC of 28.34 (95% CI: 17.86 to 39.75; p = 0.000010) recorded for that time frame. However, from 2021 to 2023, the AAMR decreased from 4 (95% CI: 3.66–4.34) in 2021 to 0.78 (95% CI: 0.64–0.92), with an APC of -59.61 (95% CI: -76.50 to -30.58; p = 0.0026), (Figure Figure 2; Supplemental Tables 1, 2, 4).
Trends by age group
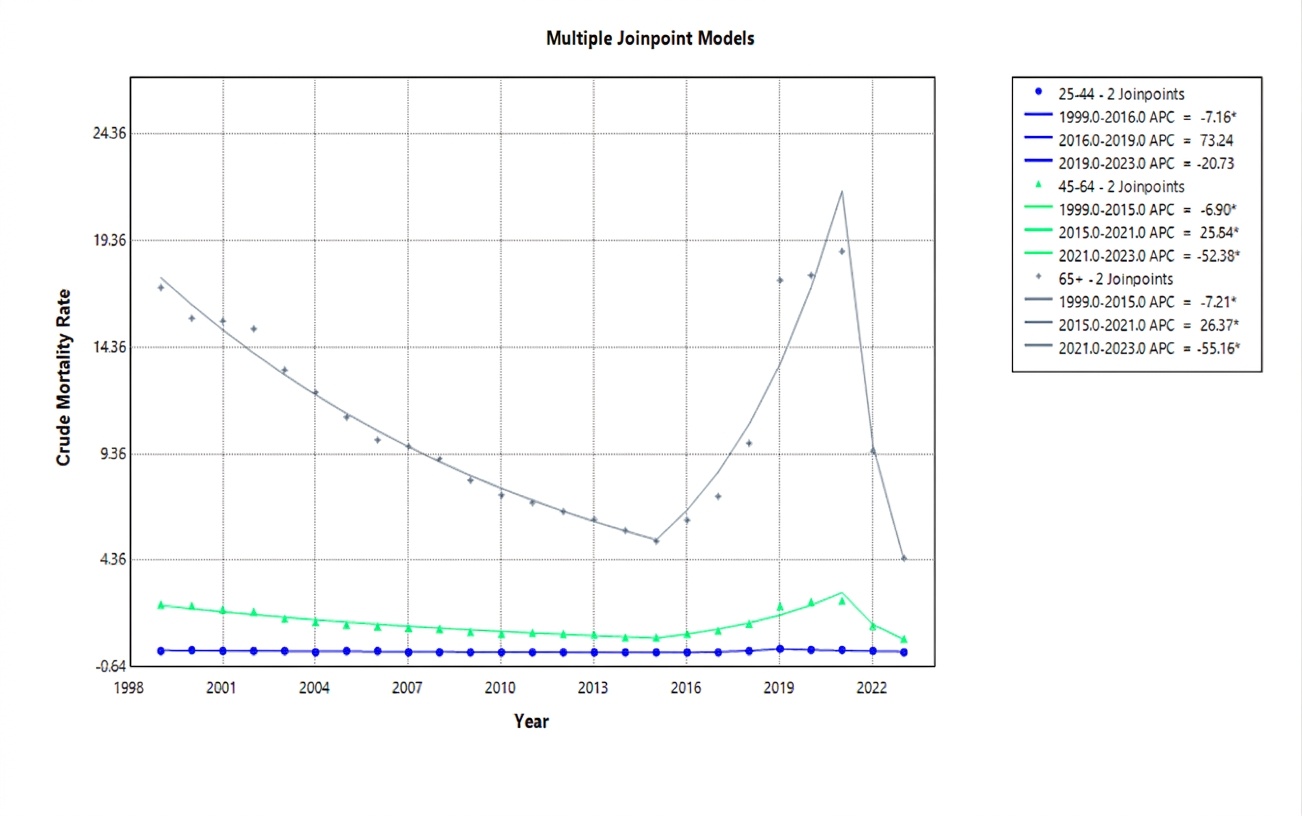
When stratified by age groups, individuals aged 65 years accounted for more deaths than individuals aged 45–64 years and 25–44 years (113,650 deaths, 28,870 deaths, and 2,124, respectively). Among adults aged 65 years, the CMR decreased from 17.06 (95% CI: 16.63 to 17.5) in 1999 to 4.22 (95% CI: 4.05 to 4.39) in 2023, with an AAPC of -5.65 (95% CI: -8.16 to -3.08; p = 0.000022). However, the CMR showed an overall downward trend among adults aged 45–64 years, decreasing from 2.3 (95% CI: 2.18 to 2.42) in 1999 to 0.77 (95% CI: 0.71 to 0.83) in 2023. The AAPC for this period was -5.07 (95% CI: -7.49 to -2.58; p = 0.00008). Furthermore, in adults aged 25–44 years, the CMR decreased from 0.11 (95% CI: 0.09 to 0.14) in 1999 to 0.06 (95% CI: 0.04 to 0.08) in 2023, with an AAPC of -2.24 (95% CI: -12.31 to 8.90; p = 0.68).
Among individuals aged 65 years, the CMR decreased from 17.06 (95% CI: 16.63 to 17.5) in 1999 to 5.1 (95% CI: 4.90–5.30) in 2015, at an APC of -7.21 (95% CI: -8.18 to -6.22; p < 0.000001). In addition, from 2015 to 2021, the CMR increased, trending from 5.1 (95% CI: 4.90–5.30) in 2015 to 17.55 (95% CI: 17.20–17.90) in 2021, with an APC of 26.37 (95% CI: 19.71 to 33.39; p < 0.000001). The CMR then decreased between 2021 and 2023, from 17.55 (95% CI: 17.20–17.90) in 2021 to 4.22 (95% CI: 4.05 to 4.39) in 2023. The APC between 2021 and 2023 was -55.16 (95% CI: -66.62 to -39.76; p = 0.000024).
On the other hand, among adults aged 45 to 64 years, the CMR initially decreased, from 2.3 (95% CI: 2.18–2.42) in 1999 to 0.84 (95% CI: 0.77–0.90) in 2015, at an APC of -6.90 (95% CI: -7.74 to -6.04; p < 0.000001). However, the CMR demonstrated a significant upward trend from 2015 to 2021, from 0.84 (95% CI: 0.77–0.90) in 2015 to 2.85 (95% CI: 2.74–2.97) in 2021. The APC for that time frame was 25.84 (95% CI: 20.30 to 31.63; p < 0.000001). In addition, from 2021 to 2023, the CMR decreased, trending from 2.85 (95% CI: 2.74–2.97) in 2021 to 0.77 (95% CI: 0.71–0.83) in 2023. The APC was -52.38 (95% CI: -64.60 to -35.95; p = 0.000061).
Among adults aged 25 to 44 years, the CMR decreased from 0.11 (95% CI: 0.09–0.14) in 1999 to 0.08 (95% CI: 0.06–0.10) in 2016, at an APC of -7.16 (95% CI: -9.61 to -4.63; p = 0.00002). In addition, from 2016 to 2019, the CMR increased, trending from 0.08 (95% CI: 0.06–0.10) in 2016 to 0.17 (95% CI: 0.14–0.19) in 2019, with an APC of 73.24 (95% CI: -26.78 to 309.94; p = 0.20). The CMR then decreased between 2019 and 2023, from 0.17 (95% CI: 0.14–0.19) in 2019 to 0.06 (95% CI: 0.04–0.08) in 2023; however, the APC between 2019 and 2023 was -20.73 (95% CI: -38.35 to 1.93; p = 0.068) (Figure Figure 3; Supplemental Tables 2, 5).
Trends by census region
Between 1999 and 2023, the Midwest accounted for the most deaths involving IHD and medical/surgical procedure-related conditions. The South, West, and Northeast followed in descending order.
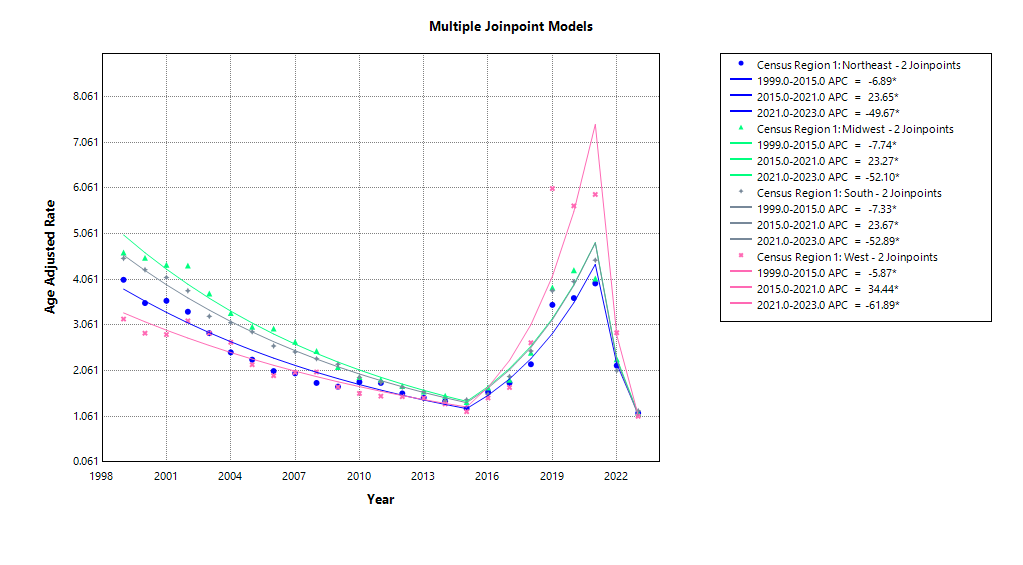
The AAMR in the South showed an overall downward trend, decreasing from 4.52 (95% CI: 4.35–4.68) in 1999 to 1.18 (95% CI: 1.11 to 1.25) in 2023, for an AAPC of -5.86 (95% CI: -7.42 to -4.27; p < 0.000001). From 1999 to 2015, the AAMR decreased from 4.52 (95% CI: 4.35–4.68) in 1999 to 1.42 (95% CI: 1.34–1.50) in 2015; the APC for that period was -7.33 (95% CI: -7.97 to -6.69; p < 0.000001). An upward trend was then observed between 2015 and 2021, with the AAMR increasing from 1.42 (95% CI: 1.34–1.50) in 2015 to 4.48 (95% CI: 4.35–4.61) in 2021, with an APC for that time frame of 23.67 (95% CI: 19.30 to 28.20; p < 0.000001). Then, the AAMR decreased from 4.48 (95% CI: 4.35–4.61) in 2021 to 1.18 (95% CI: 1.11 to 1.25) in 2023, with APC of -52.89 (95% CI: -60.60 to -43.66; p < 0.000001).
Similarly, AAMR in the West decreased overall, from 3.19 (95% CI: 3.01 to 3.38) in 1999 to 1.06 (95% CI: 0.97 to 1.14) in 2023; the AAPC was -4.57 (95% CI: -9.08 to 0.16; p = 0.058). Between 1999 and 2015, the AAMR decreased significantly from 3.19 (95% CI: 3.01 to 3.38) in 1999 to 1.16 (95% CI: 1.06–1.25) in 2015, with an APC of -5.87 (95% CI: -7.90 to -3.81; p = 0.000018). The AAMR then increased from 1.16 (95% CI: 1.06–1.25) in 2015 to 5.92 (95% CI: 5.72–6.12) in 2021, with an APC of 34.44 (95% CI: 22.12 to 48.01; p = 0.000005). The AAMR then decreased from 5.92 (95% CI: 5.72–6.12) in 2021 to 1.06 (95% CI: 0.97–1.14) in 2023, with an APC of -61.89 (95% CI: -77.5 to -35.46; p = 0.0013).
The AAMR in the Midwest decreased from 4.65 (95% CI: 4.44 to 4.85) in 1999 to 1.13 (95% CI: 1.04 to 1.22) in 2023, at an AAPC of -6.08 (95% CI: -8.31 to -3.80; p < 0.000001). From 1999 to 2015, the AAMR trended downward, from 4.65 (95% CI: 4.44 to 4.85) in 1999 to 1.37 (95% CI: 1.27–1.47) in 2015, with an APC of -7.74 (95% CI: -8.49 to -6.99; p < 0.000001). The AAMR then increased from 1.37 (95% CI: 1.27–1.47) in 2015 to 4.08 (95% CI: 3.91–4.25) in 2021, with an APC of 23.27 (95% CI: 17.72 to 29.09; p < 0.000001). From 2021 to 2023, the AAMR decreased from 4.08 (95% CI: 3.91–4.25) in 2021 to 1.13 (95% CI: 1.04 to 1.22) in 2023, with an APC of -52.10 (95% CI: -63.43 to -37.27; p = 0.000023).
In the Northeast, the AAMR decreased from 4.05 (95% CI: 3.84 to 4.25) in 1999 to 1.13 (95% CI: 1.03 to 1.22) in 2023, and the AAPC was -5.04 (95% CI: -7.68 to -2.33; p = 0.00031). The AAMR declined overall between 1999 and 2015, from 4.05 (95% CI: 3.84 to 4.25) in 1999 to 1.23 (95% CI: 1.13–1.33), with an APC of -6.89 (95% CI: -7.85 to -5.93; p < 0.000001). The AAMR increased from 1.23 (95% CI: 1.13–1.33) in 2015 to 3.97 (95% CI: 3.79–4.15) in 2021, with an APC of 23.65 (95% CI: 17.01 to 30.68; p < 0.000001). The AAMR decreased from 3.97 (95% CI: 3.79–4.15) in 2021 to 1.13 (95% CI: 1.03–1.22) in 2023, with an APC of -49.67 (95% CI: -63.19 to -31.19; p = 0.00024) (Figure Figure 4; Supplemental Tables 2, 6).
Trends by urbanization
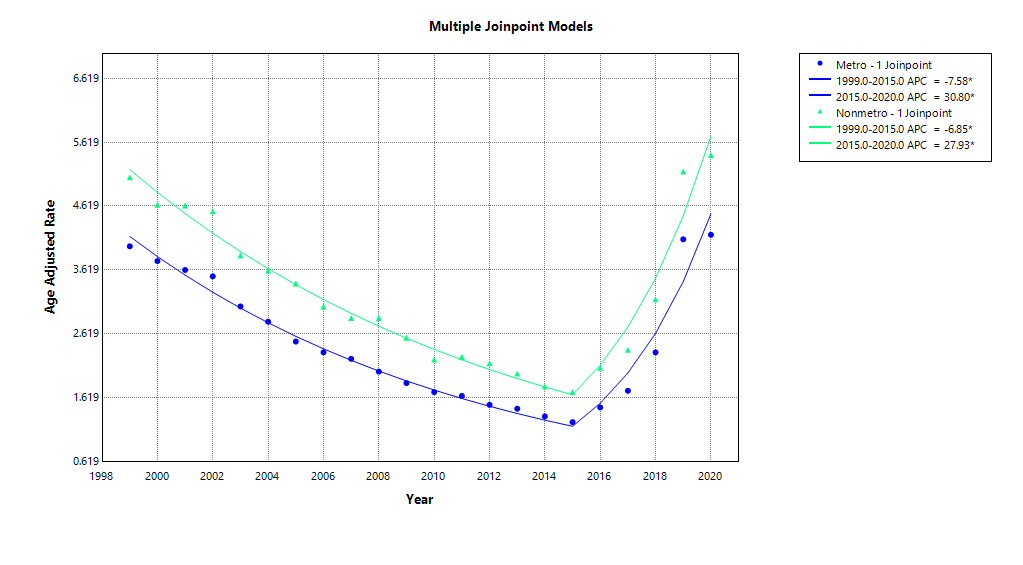
Between 1999 and 2020, metro areas accounted for more deaths than nonmetropolitan areas (95,967 deaths vs. 26,963 deaths). Overall, AAMR in metro areas in 1999 was 3.99 (95% CI: 3.89 to 4.09) and increased to 4.17 (95% CI: 4.09 to 4.26) in 2020, with an AAPC of 0.39 (95% CI: -1.06 to 1.86; p = 0.6). In nonmetropolitan areas, the AAMR in 1999 was 5.07 (95% CI: 4.83–5.31), increasing to 5.42 (95% CI: 5.19–5.64) in 2020, with an AAPC of 0.46 (95% CI: -0.68 to 1.6; p = 0.43).
Among people living in metro areas, the AAMR declined from 3.99 (95% CI: 3.89 to 4.09) in 1999 to 1.24 (95% CI: 1.19–1.29) in 2015, with an APC of -7.58 (95% CI: -8.59 to -6.56; p < 0.000001). From 2015 to 2020, the AAMR increased from 1.24 (95% CI: 1.19–1.29) in 2015 to 4.17 (95% CI: 4.09–4.26) in 2020, with an APC of 30.8 (95% CI: 23.72 to 38.29; p < 0.000001).
Among people living in nonmetropolitan areas, the AAMR declined from 5.07 (95% CI: 4.83–5.31) in 1999 to 1.71 (95% CI: 1.58–1.84) in 2015, with an APC of -6.85 (95% CI: -7.63 to -6.06; p < 0.000001). From 2015 to 2020, the AAMR showed an increase from 1.71 (95% CI: 1.58–1.84) in 2015 reaching 5.42 (95% CI: 5.19–5.64) in 2020, with an APC of 27.93 (95% CI: 22.44 to 33.65; p < 0.000001) (Figure Figure 5; Supplemental Tables 2, 7).
Discussion
Our nationwide analysis of mortality involving IHD and medical/surgical procedure-related codes among U.S. adults aged 25 years over 25 years identified three overarching patterns. First, mortality has declined substantially over the long term, with 2023 rates less than one-third of those in 1999. Second, this favorable trend was disrupted by a sharp rebound from the mid-2010s through 2021, followed by an equally steep decline thereafter – a U-shaped pattern mirrored across sex, race/ethnicity, age groups, and regions. Third, the burden remains concentrated in older adults, males, NH White and NH Black individuals, and residents of Midwest and nonmetropolitan areas, underscoring persistent demographic and geographic inequities despite overall progress.
Mortality rates were consistently higher among male individuals than female individuals, while both sexes experienced significant declines in mortality rates over time. The mortality patterns observed were similar to those reported for IHD and cardiovascular mortality more broadly, where males have historically had a greater overall burden of disease, supported by the earlier onset of atherosclerosis, a higher prevalence of multiple clustered risk factors, and differences in patterns of care for males versus females [20,21]. In addition to our earlier observation, the study supports the hypothesis that this difference persists in mortality records documenting IHD and medical/surgical procedure-related conditions and underscores the need for sex-sensitive risk stratification and secondary prevention efforts to address the differences noted above. Our analysis supports the observations noted in the literature concerning race and ethnicity; in particular, the majority of deaths in our analysis occurred among NH White individuals, who had a higher mortality rate than NH Black individuals, with AAMRs of 2.65 and 2.61 per 100,000, respectively [22,23]. The lower rates of IHD deaths documented among Hispanic and NH Asian/Pacific Islander groups were also noted in our analysis. Consistent with findings reported in the literature, previous studies have described differences in cardiovascular mortality and outcomes associated with medical and surgical care across racial and ethnic groups, including differences reported between Black and White adults, potentially reflecting variations in comorbidities, access to care, and broader social and health-system factors [24,25]. In our study, we found that these inequities persisted even when we limited the analysis to deaths coded for both IHD and medical/surgical procedure-related conditions. The very rapid and symmetrical increase in mortality from 2015 through 2021 across all racial and ethnic groups may suggest the presence of a substantial system-wide stressor during this period, potentially reflecting the possible convergence of worsening cardiometabolic risk, rising obesity-related IHD mortality, and the COVID-19 pandemic, alongside longstanding structural disparities [26,27].
Regionally, the Midwest consistently had the highest mortality rates, followed by the South, while the West and Northeast reported lower rates. These regional patterns are consistent with previously described geographic variation in the prevalence of obesity, diabetes, and hypertension, as well as differences in access to specialty and medical care across regions [28,29,30]. Our findings indicate that these regional patterns were also present in mortality records documenting both IHD and procedure-related conditions, consistent with regional differences reported for chronic IHD mortality [28,29,30].
As expected, patients aged 65 years accounted for the vast majority of deaths involving IHD and medical/surgical procedure-related conditions in our cohort. Younger patients, while contributing to a much smaller proportion of deaths involving IHD, still accounted for a significant share of the overall deaths documenting medical/surgical procedure-related conditions. This finding is consistent with the age gradient associated with CVD and IHD incidence [31,32]. Older patients may have a higher prevalence of underlying atherosclerotic disease and a greater accumulated atherosclerotic burden, as well as multiple comorbidities and frailty, which may increase their susceptibility to hemodynamic (blood flow) stress and other physiological stressors associated with medical and surgical procedures [33,34]. In addition, recent studies have shown that postoperative acute heart failure and Myocardial Injury after Noncardiac Surgery (MINS) are particularly lethal among older patients, with one-year mortality rates for these events often exceeding those observed in comparable non-surgical patient cohorts [35,36,37]. These findings suggest prioritizing cardiovascular care optimization among older patients, with particular attention to comprehensive risk assessment, management of cardiovascular risk factors, and appropriate follow-up.
Although metropolitan areas had higher crude death counts, AAMRs declined in both metropolitan and nonmetropolitan areas through 2020, with mortality rates remaining relatively similar between the two groups toward the end of the study period [23]. Our findings suggest that the mid-2010s reversal and COVID-19-era changes in mortality involving IHD and procedure-related conditions may have affected metropolitan and nonmetropolitan settings in parallel, potentially reflecting shared factors such as changes in case mix, delayed elective surgical care, and health-system strain [38].
Temporal changes in mortality may partly reflect differences in death-certificate documentation and coding practices, which can influence observed IHD mortality trends [39]. Because MCOD data lack detailed patient-level clinical information, the observed patterns cannot establish underlying mechanisms or causal pathways.
Clinical implications
Cardiovascular risk assessment and optimization are important components of managing adults with IHD. Previous clinical research suggests that systematic risk assessment, including risk scoring and targeted troponin surveillance among patients considered at high risk, may help inform cardiovascular management in the context of medical and surgical procedures [40,41,42]. Further research is needed to determine whether these approaches improve population-level mortality outcomes.
Accordingly, the observed decline in mortality over the past several decades may reflect, in part, advances in IHD management and the broader evolution of medical and surgical care. Nevertheless, the observed patterns also suggest that these improvements may remain vulnerable to broader system-wide stressors.
Therefore, we hypothesize that future research should evaluate whether tailored cardiovascular care pathways for older adults, Black patients, rural populations, and populations residing in regions with a high burden of morbidity and mortality, particularly the Midwest, may improve cardiovascular outcomes compared with generalized approaches to cardiovascular care. At the health-system level, the observed mortality patterns were broadly consistent with existing disparities in cardiometabolic health across demographic and geographic groups, suggesting that cardiovascular care should be considered within the broader continuum of population-level cardiovascular prevention and care [43,44,45].
Strengths, limitations, and future directions
The study’s main strengths are its national scope, 25-year duration, and large sample size, as well as its consistent use of CDC WONDER data and joinpoint regression across sex, race/ethnicity, age, region, and urbanization. By explicitly using both IHD (I20–I25) and medical/surgical procedure-related codes (Y83–Y84), we identify mortality records documenting IHD and procedure-related conditions, providing a focused analysis not performed in earlier national studies of IHD mortality or perioperative MI/MINS.
However, the following limitations should be noted. First, death certificate data are vulnerable to errors in identifying both the underlying cause of death and contributing conditions. Furthermore, Y83–Y84 coding may not capture all mortality records involving medical or surgical procedures and does not provide information on the timing, type of procedure performed, or clinical course surrounding the procedure. Second, CDC WONDER is not designed to include clinical variables such as coronary anatomy, revascularization strategy, prescribed medications, or hemodynamic parameters, which limits our ability to compare risk-adjusted outcomes or infer mechanisms underlying the observed mortality patterns. Third, urbanization data are available only through 2020, which prevents a complete understanding of urban–rural patterns during the height and immediate post-COVID-19 era. Lastly, as with all ecological studies, we cannot determine the causal impact of policies, clinical processes, or pandemic patterns on observed trends.
Researchers should integrate vital statistics with surgical registries and electronic health record databases to evaluate risks associated with specific types of procedures, identify variation in outcomes across hospitals, and better understand how guideline-based cardiovascular interventions may affect overall mortality rates. In addition, future studies should evaluate how the adoption of newer techniques for the management of IHD in vulnerable populations, including routine troponin monitoring, structured cardiovascular care pathways, telehealth-enabled prehabilitation, and other approaches, may impact mortality involving IHD and medical/surgical procedure-related conditions [46,47].
Conclusion
In this nationwide analysis of U.S. adults aged 25 years, mortality involving IHD and medical/surgical procedure-related conditions declined substantially from 1999 to 2023, with 2023 rates less than one-third of those observed in 1999. However, this long-term improvement was interrupted by a marked increase from the mid-2010s through 2021, followed by a steep decline thereafter, producing a consistent U-shaped temporal pattern across demographic and geographic subgroups. Mortality was concentrated among older adults and males, with substantial mortality among NH White and NH Black individuals and across Midwestern and nonmetropolitan populations. These findings highlight substantial and persistent demographic and geographic disparities despite overall improvements in mortality. Continued efforts to strengthen perioperative cardiovascular risk assessment, prevention, and care, particularly among the highest-risk populations, are warranted.
Prior Presentation
This analysis was previously presented in abstract form at TCT 2025 and published as: Hemida M, Saghir M, Ibrahim A, et al. TCT-296 25-year trends in postoperative mortality in U.S. adults with ischemic heart disease. J Am Coll Cardiol. 2025;86(17 Suppl):B131–B132.
Conflicts of Interest
The authors declare no competing interests that could have influenced the objectivity or outcome of this research.
Funding Source
This research received no external funding.
Acknowledgments
None.
Institutional Review Board (IRB)
Institutional review board approval was not required because the study used publicly available, de-identified mortality data.
Informed Consent
Not applicable.
Large Language Model
None.
Authors Contribution
MA, YR, and MFH contributed to the conceptualization of the study and to the methodology, while MA, AHM, MS, AAI, AG, WQ, KP, MMAE, OKE, IE, SE, AE, and WB were responsible for investigation. YR, AHM, MS, AG, WQ, MMAE, and OKE were responsible for data curation, and YR performed the statistical analysis. MA, YR, AHM, MS, AAI, AG, WQ, KP, MMAE, OKE, IE, SE, AE, and WB assisted in drafting the manuscript, while YR and MFH supervised the study and were responsible for project administration. All authors reviewed and approved the final manuscript and agreed to be accountable for the work.
Data Availability
The data that support the findings of this study are openly available in CDC WONDER at https://wonder.cdc.gov/. Further inquiries can be directed to the corresponding author.
References
- Martin S. S., Aday A. W., Allen N. B., Almarzooq Z. I., Anderson C. A. M., Arora P., et al. 2025 Heart Disease and Stroke Statistics: A Report of {US} and Global Data From the {A}merican {H}eart {A}ssociation. Circulation. 2025;151(8):e41-e660. doi:10.1161/CIR.0000000000001303 PMID: 39866113 PMCID: PMC12256702
- Khalid N., Haider S., Abdullah M., Asghar S., Laghari M. A., Rajeswaran Y.. Trends and disparities in coronary artery disease prevalence among {U.S.} adults from 2019 to 2022. Curr Probl Cardiol. 2024;49(8):102645. doi:10.1016/j.cpcardiol.2024.102645 PMID: 38796947
- Centers for Disease Control and Prevention. Heart Disease Facts. 2024.
- Mohebi R., Chen C., Ibrahim N. E., McCarthy C. P., Gaggin H. K., Singer D. E., Hyle E. P., Wasfy J. H., Januzzi Jr., J. L.. Cardiovascular disease projections in the {U}nited {S}tates based on the 2020 census estimates. J Am Coll Cardiol. 2022;80(6):565-578. doi:10.1016/j.jacc.2022.05.033 PMID: 35926929 PMCID: PMC9396356
- Sweitzer B.. Perioperative evaluation and optimization of patients at risk of cardiac complications for non-cardiac surgery. Mo Med. 2016;113(4):320-324. PMID: 30228486 PMCID: PMC6139923
- Song M. G., Kim C. W., Song S. Y., Kim H. G., Kim D. H.. Management of patients with ischemic heart disease in spine surgery. Asian Spine J. 2023;17(6):1168-1175. doi:10.31616/asj.2023.0161 PMID: 38105637 PMCID: PMC10764142
- Ruetzler K., Smilowitz N. R., Berger J. S., Devereaux P. J., Maron B. A., Newby L. K., et al. Diagnosis and management of patients with myocardial injury after noncardiac surgery: a scientific statement from the {A}merican {H}eart {A}ssociation. Circulation. 2021;144(19):e287-e305. doi:10.1161/CIR.0000000000001024 PMID: 34601955
- Kashlan B., Kinno M., Syed M.. Perioperative myocardial injury and infarction after noncardiac surgery: a review of pathophysiology, diagnosis, and management. Front Cardiovasc Med. 2024;11:1323425. doi:10.3389/fcvm.2024.1323425 PMID: 38343871 PMCID: PMC10853429
- Hedge J., Balajibabu P. R., Sivaraman T.. The patient with ischaemic heart disease undergoing non cardiac surgery. Indian J Anaesth. 2017;61(9):705-711. doi:10.4103/ija.IJA_384_17 PMID: 28970628 PMCID: PMC5613595
- Thompson A., Fleischmann K. E., Smilowitz N. R., de las Fuentes L., Mukherjee D., Aggarwal N. R., et al. 2024 {AHA/ACC/ACS/ASNC/HRS/SCA/SCCT/SCMR/SVM} guideline for perioperative cardiovascular management for noncardiac surgery: a report of the {A}merican {C}ollege of {C}ardiology/{A}merican {H}eart {A}ssociation {J}oint {C}ommittee on {C}linical {P}ractice {G}uidelines. Circulation. 2024;150(19):e351-e442. doi:10.1161/CIR.0000000000001285 PMID: 39316661
- Cohn S. L.. 2024 {ACC/AHA} guideline on perioperative cardiovascular management before noncardiac surgery: what's new?. Cleve Clin J Med. 2025;92(4):213-219. doi:10.3949/ccjm.92a.24125 PMID: 40169218
- Ali M. F., Ahmad H., Qadri M., et al. The weight of risk: epidemiological trends in mortality involving cardiac arrest and obesity in the {U}nited {S}tates (1999--2023). J Diabetes Metab Disord. 2026;25:236. doi:10.1007/s40200-026-02037-9
- Faheem M. S. B., Fatima Y., Munir S. U., Khabir M., Khatri N.. Trends in ischemic heart disease and thromboembolism-related mortality in the {U}nited {S}tates, 1999--2024: a population-based analysis using {CDC WONDER} data. Thromb Res. 2025;255:109482. doi:10.1016/j.thromres.2025.109482 PMID: 40987074
- Hemida M., Saghir M., Ibrahim A., et al. {TCT-296} 25-year trends in postoperative mortality in {U.S.} adults with ischemic heart disease. J Am Coll Cardiol. 2025;86(17 Suppl):B131-B132. doi:10.1016/j.jacc.2025.09.395
- von Elm E., Altman D. G., Egger M., Pocock S. J., G\otzsche P. C., Vandenbroucke J. P.. The {S}trengthening the {R}eporting of {O}bservational {S}tudies in {E}pidemiology ({STROBE}) statement: guidelines for reporting observational studies. J Clin Epidemiol. 2008;61(4):344-349. doi:10.1016/j.jclinepi.2007.11.008 PMID: 18313558
- Aggarwal R., Chiu N., Loccoh E. C., Kazi D. S., Yeh R. W., Wadhera R. K.. Rural-urban disparities: diabetes, hypertension, heart disease, and stroke mortality among {B}lack and {W}hite adults, 1999--2018. J Am Coll Cardiol. 2021;77(11):1480-1481. doi:10.1016/j.jacc.2021.01.032 PMID: 33736831
- Ingram D. D., Franco S. J.. 2013 {NCHS} urban-rural classification scheme for counties. Vital Health Stat 2. 2014:1-73. PMID: 24776070
- Anderson R. N., Rosenberg H. M.. Age standardization of death rates: implementation of the year 2000 standard. Natl Vital Stat Rep. 1998;47(3):1-16. PMID: 9796247
- National Cancer Institute. Joinpoint Regression Program, Surveillance Research Program. 2025.
- Wang Y., Sun X., Zhang X., Wang X., Li J., Wang K.. Global, regional, and national burden of early-onset ischemic heart disease: trends and projections among adults aged 15--44 years from 1990 to 2046. Front Cardiovasc Med. 2025;12:1653335. doi:10.3389/fcvm.2025.1653335 PMID: 40951829 PMCID: PMC12426116
- Wolf S., Schievano E., Amidei C. B., et al. Mortality trend of ischemic heart disease (2008--2022): a retrospective analysis of epidemiological data. Int J Cardiol. 2024;406:132042. doi:10.1016/j.ijcard.2024.132042 PMID: 38614362
- Sosa IV, D., Blankenship J. C.. Racial disparities in ischemic heart disease. J Clin Cardiol Cardiovasc Interv. 2022;5(7). doi:10.31579/2641-0419/269
- Hemida M. F., Ibrahim A. A., Goel A., et al. Twenty-five years of angina-related mortality in elderly adults aged $\ge$65 years: a retrospective cohort study using real-world data from the {USA}. ASIDE Int Med. 2025;2(3):33-42. doi:10.71079/ASIDE.IM.110925248
- Kibrik P., Rao A., Zhu J., Bai H., Storch J., Han D., Ting W., Marin M., Faries P.. Impact of race on perioperative outcomes following carotid endarterectomy, transfemoral carotid artery stenting, and transcarotid artery revascularization. J Vasc Surg. 2023;78(2):e93-e94.
- Kyalwazi A. N., Loccoh E. C., Brewer L. C., et al. Disparities in cardiovascular mortality between {B}lack and {W}hite adults in the {U}nited {S}tates, 1999 to 2019. Circulation. 2022;146(3):211-228. doi:10.1161/CIRCULATIONAHA.122.060199 PMID: 35861764 PMCID: PMC9310198
- Wang Y., Li Q., Bi L., Wang B., Lv T., Zhang P.. Global trends in the burden of ischemic heart disease based on the global burden of disease study 2021: the role of metabolic risk factors. BMC Public Health. 2025;25(1):310. doi:10.1186/s12889-025-21588-9 PMID: 39856644 PMCID: PMC11763131
- Janus S. E., Makhlouf M., Chahine N., Motairek I., Al-Kindi S. G.. Examining disparities and excess cardiovascular mortality before and during the {COVID-19} pandemic. Mayo Clin Proc. 2022;97(12):2206-2214. doi:10.1016/j.mayocp.2022.07.008 PMID: 36336516 PMCID: PMC9300586
- Ferdinand A. O., Akinlotan M. A., Callaghan T., Towne Jr., S. D., Bolin J.. Diabetes-related hospital mortality in the {U.S.}: a pooled cross-sectional study of the {N}ational {I}npatient {S}ample. J Diabetes Complications. 2019;33(5):350-355. doi:10.1016/j.jdiacomp.2019.01.007 PMID: 30910276
- Ashfaq F., Zain A., Ahmad K., et al. Trends in mortality from acute myocardial infarction among the obese population in the {U}nited {S}tates from 1999 to 2020: insights from {CDC WONDER}. Arch Med Sci Atheroscler Dis. 2025;10:e211-e219. doi:10.5114/amsad/210584 PMID: 41142685 PMCID: PMC12550666
- Brereton B. J., Desai R. V., Yarrarapu S. N. S., Matos Urena J. G., Jain A. P.. Regional disparities of cardiovascular risk factors and major cardiovascular events in non-electively hospitalized young adults. J Community Hosp Intern Med Perspect. 2023;13(2):1-6. doi:10.55729/2000-9666.1164 PMID: 37168061 PMCID: PMC10166212
- Lagoo-Deenadayalan S. A., Newell M. A., Pofahl W. E.. Common perioperative complications in older patients. Principles and Practice of Geriatric Surgery. 2011:361-376. doi:10.1007/978-1-4419-6999-6_29
- Chawan A. P., Rathore Y. S., Chumber S., Kataria K.. Surgical diseases and surgical outcomes in geriatric patients. Int Surg J. 2020;7(10):3315-3320. doi:10.18203/2349-2902.isj20204129
- Islam M. S., Maruf A. Al, Mazumder M. M., Rahman M. A., Siraj S. Bin. Cardiovascular challenges in geriatric anesthesia after induction of {GA}. Ann Int Med Dent Res. 2023;9:191-196. doi:10.53339/aimdr.2023.9.28
- Au Yong P. S. A., Sim E. Y. L., Ho C. Y. X., et al. Association of multimorbidity with frailty in older adults for elective non-cardiac surgery. Cureus. 2021;13(5):e15033. doi:10.7759/cureus.15033 PMID: 34150384 PMCID: PMC8200322
- Gewarges M., Frankfurter C., McDonald M.. Perioperative assessment and management of patients with heart failure. Can J Gen Intern Med. 2022;17(SP1):28-37. doi:10.22374/cjgim.v17iSP1.604
- Beattie W. S., Wijeysundera D. N.. The growing burden of perioperative heart failure. Anesth Analg. 2014;119(3):506-508. doi:10.1213/ANE.0000000000000370 PMID: 25136995
- Smilowitz N. R., Redel-Traub G., Hausvater A., et al. Myocardial injury after noncardiac surgery: a systematic review and meta-analysis. Cardiol Rev. 2019;27(6):267-273. doi:10.1097/CRD.0000000000000254 PMID: 30985328 PMCID: PMC6776733
- Mehta A., Awuah W. A., Ng J. C., et al. Elective surgeries during and after the {COVID-19} pandemic: case burden and physician shortage concerns. Ann Med Surg (Lond). 2022;81:104395. doi:10.1016/j.amsu.2022.104395 PMID: 35999832 PMCID: PMC9388274
- Chen L., Walker S., Tong S.. The impact of the variation in death certification and coding practices on trends in mortality from ischaemic heart disease. Aust Health Rev. 2002;25(4):189-197. doi:10.1071/ah020189a PMID: 12404982
- Segerson K. E.. Ischemic heart disease. The Perioperative Medicine Consult Handbook. 2020:59-64. doi:10.1007/978-3-030-19704-9_9
- Mahendran S., Thiagalingam A., Hillis G., Halliwell R., Pleass H. C., Chow C. K.. Cardiovascular risk management in the peri-operative setting. Med J Aust. 2023;219(1):30-39. doi:10.5694/mja2.51988 PMID: 37302136
- Fisher B.. Peri-operative cardiovascular risk and the general internist. Can J Gen Intern Med. 2014;9(2):53-59. doi:10.22374/cjgim.v9i2.40
- Gottumukkala V., Vetter T. R., Gan T. J.. Perioperative medicine: what the future can hold for anesthesiology. Anesth Analg. 2023;136(4):628-635. doi:10.1213/ANE.0000000000006412 PMID: 36928147
- McLeod M., Signal V., Gurney J., Sarfati D.. Postoperative mortality of indigenous populations compared with nonindigenous populations: a systematic review. JAMA Surg. 2020;155(7):636-656. doi:10.1001/jamasurg.2020.0316 PMID: 32374369
- Bhave N. M., Eagle K. A.. Trends in perioperative cardiovascular events: mostly sunny, with showers. JAMA Cardiol. 2017;2(2):188-189. doi:10.1001/jamacardio.2016.4786 PMID: 28030654
- Azizi P. M., Wijeysundera D. N., Wijeysundera H. C., et al. Troponin testing after noncardiac surgery: a population-based historical cohort study on variation and factors associated with testing in {O}ntario. Can J Anaesth. 2022;69(5):572-581. doi:10.1007/s12630-022-02219-y PMID: 35386054
- Jones C., Sritharan K., Abu-Habsa M.. Identification and management of perioperative cardiovascular risk. Br J Hosp Med (Lond). 2010;71(1):M12-M15. doi:10.12968/hmed.2010.71.Sup1.45984 PMID: 20081650