Trends and Disparities of CVD Underlying-Cause Deaths with Pneumonia and Influenza Mentioned on the Death Certificate in the United States: A CDC WONDER Analysis
Ahmed A. BadawiⒾ1*, Amjad S. IbrahimⒾ1, Mohammad A. BadawiⒾ1, Aseel M. ShalalfehⒾ1, Ameen M. BsharatⒾ1, Maram M. Abukhalil1, Anwar ZahranⒾ1, Mohammad BdairⒾ1
- 1Department of Medicine, An-Najah National University, Nablus, Palestine
Abstract
Background: Pneumonia and influenza (P&I) may precipitate cardiovascular decompensation, yet long-term U.S. mortality patterns of P&I co-mention at death among cardiovascular disease (CVD) deaths are not well described across sociodemographic and geographic strata.
Methods: Using CDC WONDER multiple-cause-of-death data, we identified deaths with CVD as the underlying cause (ICD-10 I00–I99) and P&I (J09–J18) mentioned anywhere on the death certificate. We calculated crude and age-adjusted mortality rates (AAMR, per 100,000; 2000 U.S. standard), assessed 1999–2023 trends with Joinpoint regression, selected descriptive subgroup and interstate mapping summaries used 1999–2020.
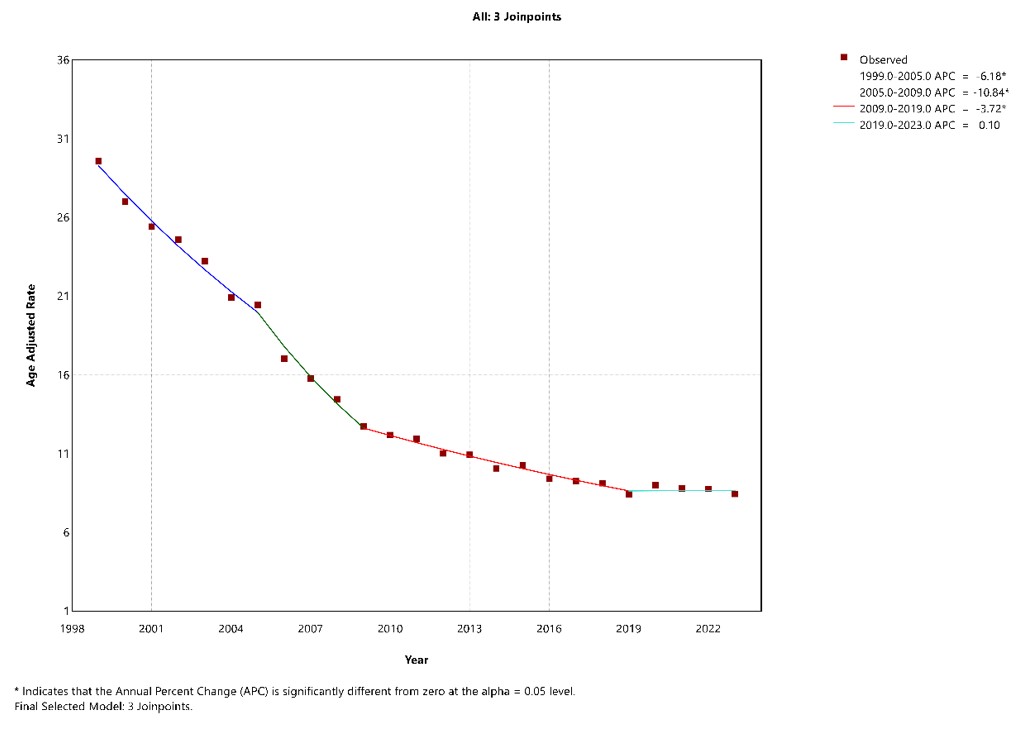
Results: AAMR declined from 29.58 (1999) to 8.45 (2023) (-71.4%), with joinpoints in 2005, 2009, and 2019 and a plateau after 2019. Mortality increased with age; adults ≥85 years accounted for 47.3% of deaths and the highest crude rate (277.9 per 100,000). In 2023, AAMR was higher in males than in females (10.69 vs 6.73). Rates were higher in Black than White decedents (10.7 vs 9.5 per 100,000) and highest in rural areas, with marked interstate heterogeneity.
Conclusions: AAMRs declined during 1999–2023 but plateaued after 2019, with heterogeneity by age, geography, and race/ethnicity. These descriptive co-mention patterns highlight higher-rate groups and areas that may warrant prioritization for further investigation and prevention planning; they do not establish causal pathways or quantify the impact of structural determinants.
Keywords: Cardiovascular mortality, Pneumonia and influenza, Health disparities, Age-adjusted mortality, Geographic variation
Article information
Introduction
Cardiovascular disease (CVD) remains the leading cause of death in the United States, making any common trigger of acute cardiovascular decompensation a major public-health concern [1]. Seasonal influenza activity has become increasingly sharp every year during the U.S. fall-winter period, resulting in predictable surges in respiratory diseases that may coincide at the population level with periods of increased acute cardiovascular events [2]. Beyond typical respiratory deaths, influenza-attributable mortality based on U.S. death certificates demonstrates substantial year-to-year variability and a disproportionate burden among older adults [3]. However, death-certificate multiple-cause coding in this study captures only co-mention at death and cannot establish infection timing, triggering, or attributable risk.
There is epidemiologic evidence supporting influenza as a short-term cardiovascular trigger, and a national observational study found a higher incidence of acute myocardial infarction (AMI) during weeks with greater influenza activity, even after adjustment for meteorological effects [4]. Mechanistically, influenza may amplify systemic inflammation and coagulation signalling, thereby promoting endothelial dysfunction and plaque instability, potentially elevating thrombosis-related morbidity such as AMI and stroke [5]. Pneumonia shows a parallel cardiovascular footprint: a systematic review and meta-analysis discovered that cardiac complications are frequent in community-acquired pneumonia and are associated with worse outcomes [6]. Consistent with this, a large prospective cohort of hospitalized community-acquired pneumonia patients reported frequent in-hospital acute cardiovascular events and increased short-term mortality among those who developed such complications [7]. Accordingly, we cite the triggering-events literature for biological plausibility, but interpret our findings as descriptive co-recording of pneumonia/influenza among CVD underlying-cause deaths, not proof of causal triggering.
Because fatal illnesses are often associated with interacting conditions, analyses restricted to a single cause can undercount deaths in which influenza or pneumonia was an important contributive factor in cardiovascular deterioration [8]. The explicit fact of multiple-cause-of-death coding includes any mention of a contributing condition (up to 20 causes on a specific certificate) to achieve a more realistic determination of co-occurring respiratory infection and co-occurring CVD at death. This approach is widely used in modern burden estimations; for example, large-scale U.S. death certificate analysis has been used to quantify the number of influenza-related deaths over a wide time span [3].
Disparities also matter: U.S. surveillance analyses have documented racial and ethnic differences in the morbidity associated with severe influenza, including hospitalization, ICU admissions, and in-hospital death across multiple seasons [9]. At the mortality level, geographic variation in racial disparity of influenza and pneumonia has been demonstrated across U.S. regions and urbanization strata, illustrating that there is no even distribution of risk [10]. Regarding pneumonia mortality in general, many recent reports in the U.S. show consistent differences by sex, race, and rurality, which confirms the possibility of structural and access-related contributors to unequal outcomes [11].
Although there is biological plausibility and growing evidence linking influenza and pneumonia to cardiovascular events and adverse outcomes, long-horizon descriptions of how often these conditions co-occur on death certificates – and how that pattern varies over time, by age, race/ethnicity, and state – remain fragmented. Although prior U.S. work has described influenza- and pneumonia-related mortality trends using death certificates, key gaps remain in characterizing how P&I are co-recorded with cardiovascular mortality across time and place. Specifically, it is not well described (i) whether the long-term declines in P&I co-mentions among CVD deaths changed after 2019 (including potential plateauing), (ii) how patterns vary simultaneously by age, race/ethnicity, urbanization, and state. We therefore aimed to describe annual trends and subgroup/state gradients of U.S. death certificates in which P&I co-occur with CVD characterize recent trend changes. We focused the primary analysis on deaths with CVD as the underlying cause and P&I recorded anywhere on the death certificate to anchor inference to the burden of CVD mortality with concurrent respiratory infection conditions. This objective is conceptually distinct from studying primary respiratory mortality (P&I as the underlying cause), where CVD may be listed incidentally as a comorbidity.
Methods
Study Design and Data Source
This retrospective, population-based study analyzed U.S. nationwide mortality data from 1999 – 2023 from the CDC WONDER Multiple Cause of Death database that is derived from the National Vital Statistics System, which includes all conditions reported on death certificates and therefore allows for determining deaths in which an influenza or pneumonia co-occurred with CVD, independent of the underlying cause of death designation. All crude and AAMRs used general population denominators (U.S. resident population) and therefore represent population mortality rates of CVD underlying-cause deaths with P&I mentioned on the death certificate, rather than mortality rates among a cohort of individuals living with diagnosed CVD. To enable reproducibility, the exact CDC WONDER extraction specification (request type, years, ICD-10 filters, groupings, and output options) is provided in the Supplement. Briefly, we used the CDC WONDER Multiple Cause of Death (Detailed Mortality) request to obtain annual counts and rates, applying the ICD-10 filters described below and grouping by year and the relevant stratifying variables (sex, race/ethnicity, urbanization, and state). CDC WONDER suppression rules were respected: cells suppressed for confidentiality (small counts) were treated as missing (not zero), and strata with suppressed/unstable estimates were not interpreted; where suppression affected rate calculations or mapping stability, the affected strata were excluded from those specific comparisons and flagged in the corresponding tables/figures. The final 1999 – 2023 analytic series was assembled from two separate CDC WONDER extracts: one covering 1999 – 2020 and a second covering 2018 – 2023. For the three overlapping calendar years (2018 – 2020), annual death counts and age-adjusted mortality rates from both extracts were cross-checked prior to constructing the final series; counts and rates for each overlapping year matched exactly across the two extractions, and no discontinuity or artificial inflection was identified at the merge point.
CDC WONDER suppresses cells with deaths <10; however, in our extracted annual series none of the analytic strata-years met the suppression threshold for the time-series analyses, so no values were suppressed in the joinpoint. An exception is Table 1, where a small number of ‘Unknown/Not stated’ records were excluded from the displayed subgroup rows (per WONDER’s output categories), which is why section totals may not fully reconcile.
Place of death was obtained from the CDC WONDER Multiple Cause of Death “Place of Death” variable and is reported as counts and percentages (rates not applicable). Categories included inpatient, outpatient/ER, dead on arrival, status unknown (1999 – 2002 only), home, hospice (2003+), nursing home/long-term care, other, and unknown. Percentages used the total deaths shown in the table as the denominator, with “other” and “unknown” included.
Case Definition
This study included all deaths in the United States with CVD as the underlying cause of death. We defined the outcome as deaths with CVD as the underlying cause of death (ICD-10 I00 – I99) and pneumonia and/or influenza (P&I; ICD-10 J09 – J18) mentioned anywhere on the death certificate among multiple causes of death (i.e., a co-mention, not a causal attribution). A death was included if influenza or pneumonia was mentioned anywhere on the death certificate, as a contributing cause in conjunction with a cardiovascular diagnosis. Analyses were restricted to decedents aged ≥15 years. Deaths among individuals <15 years were excluded because CVD is rare in childhood, and small cell counts in younger age strata are frequently suppressed in CDC WONDER for confidentiality. All totals and percentages reported in age-stratified analyses reflect inclusion of decedents aged 15 years and older only.
Outcome Measures
The main outcome was the age-adjusted mortality rate (AAMR), which was expressed per 100,000 people. Age adjustment was done under the direct standardization method with the 2000 U.S. standard population as the reference. The rates of mortality were estimated in the general population and stratified by sex, race/ethnicity, and urbanization level. Place of death was summarized descriptively (counts and percentages) using the CDC WONDER ‘Place of Death’ variable from death certificates. For between-group comparisons (e.g., sex, race/ethnicity, urbanization, and state), we used age-adjusted rates throughout; crude rates were reserved only for within-age-band descriptions (i.e., age-specific rates) and are explicitly labeled as such when presented. Descriptive subgroup analyses, including age-group summaries, place of death, urbanization gradients, and state-level choropleth maps, were restricted to 1999 – 2020 due to CDC WONDER suppression and instability in small cells across certain subgroup cross-tabulations in more recent years; these analyses are therefore presented as pre-pandemic historical summaries and should not be interpreted as reflecting the contemporary post-pandemic context described in the full 1999 – 2023 trend analyses. The COVID-19 pandemic and post-pandemic period (2020 onward) may have materially altered care-setting patterns, geographic distributions, and subgroup disparities; readers should exercise caution when extrapolating the 1999 – 2020 descriptive findings to the current period.
Temporal and Geographic Analyses
Temporal trends in AAMRs were measured using joinpoint regression with the National Cancer Institute Joinpoint Regression Program. The log-transformed rates in mortality were modeled in order to determine statistically significant inflections over time, corresponding to changes in trend direction or magnitude. The annual percent change (APC) was estimated for each of the identified segments, and the average annual percent change (AAPC) across the full study period. The maximum number of joinpoints was four, and the selection of the model was based on using the permutation tests. The statistical significance was evaluated by having a two-sided alpha level of 0.05, and all estimates were presented with the 95% confidence intervals (CI). Within-year (monthly or seasonal) variation in AAMRs was not evaluated in this study.
Geographic strata in CDC WONDER reflect the decedent’s legal place of residence at the time of death (state and county of residence), not the county of occurrence. Urbanization level was obtained from the CDC WONDER Multiple Cause of Death dataset “Urbanization” variable, which assigns each death to an NCHS urban – rural category based on the decedent’s county of residence (Large Central Metro, Large Fringe Metro, Medium Metro, Small Metro, Micropolitan, and Noncore). Place of death was analyzed separately using death-certificate place-of-death categories and should not be interpreted as a residence-based measure. Records with missing/unknown residence geography (and therefore unassigned urbanization) were excluded from geography- and urbanization-stratified tabulations, but were retained in national-level totals.
Geographic variation in mortality rates of CVD as the underlying cause and P&I mentioned as contributing causes was examined using state-level age-adjusted mortality rates. These rates in the mortality burden throughout the U.S. were visualized using choropleth maps. Where mapping stability was a concern (e.g., small counts/suppression), we applied stability rules described in the Supplementary Methods and avoided interpretation of unstable strata; maps are labeled consistently as age-adjusted and based on residence state. Reproducible techniques were used for all data representation and computational workflows.
Statistical Analysis and Ethics
All mortality rates were expressed per 100,000 population. Using reproducible computational workflows, statistical analyses, and data visualization, while Joinpoint analyses were performed using the National Cancer Institute Joinpoint software. Subgroup-specific descriptive summaries (e.g., sex, race/ethnicity, urbanization, and place of death) were derived from CDC WONDER tabulations that exclude records with missing or unknown values for the stratifying variable. Therefore, subgroup totals may not equal the overall national death count because records with unknown or suppressed characteristics are omitted from those stratified tabulations. All subgroup percentages are calculated using the total number of deaths available within each stratified extraction as the denominator. Race/ethnicity on death certificates is subject to misclassification (notably for American Indian/Alaska Native and Native Hawaiian/Other Pacific Islander decedents) and may be affected by changes in coding/bridging practices over time; because CDC WONDER provides aggregated tabulations, no individual-level mitigation was possible, and we interpret disparity estimates with this limitation in mind. The present research involved publicly available, de-identified data; therefore, it did not require informed consent or approval from the institutional review board (IRB).
Results
Crude mortality rates by age group
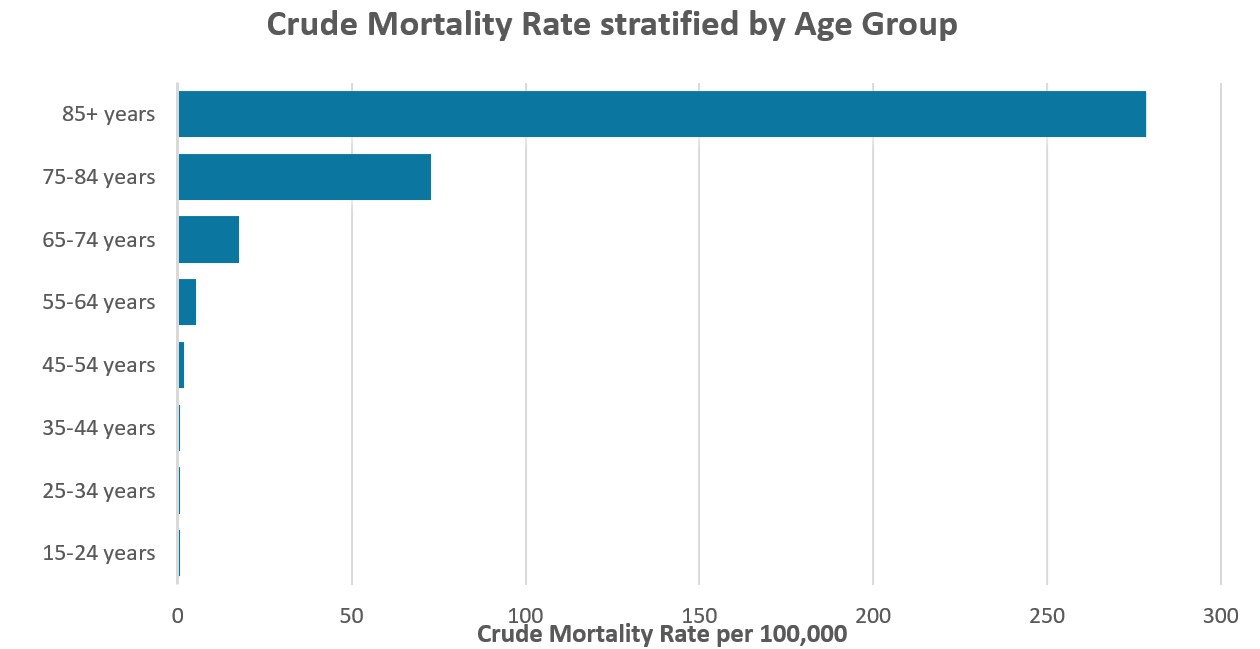
In the U.S., between 1999 and 2023, 772,865 deaths were identified from the U.S. death certificates in which CVD was listed as the underlying cause of death and P&I was listed as a contributing cause of death, with an absolute decrease of 21.13 per 100,000 and 71.4% relative reduction in the AAMR between 1999 and 2023 (29.58 and 8.45, respectively). Unless otherwise specified, temporal trend analyses. Among decedents aged ≥15 years, crude mortality in age-stratified descriptive analyses (1999 – 2020) increased steeply with age. Age-stratified crude-rate summaries are shown for 1999 – 2020 because WONDER suppression/instability in small cells (particularly in younger strata and some subgroup cross-tabulations) limited stable tabulation of certain descriptive strata through 2023; the full-period (1999 – 2023) trend analyses remain based on annual AAMRs.
The lowest rate of crude mortality was noted among persons aged 15 – 24 years (0.1 per 100,000; 696 deaths, 0.1%), and the highest count of crude mortality was found among persons aged 85 years and over (277.9 per 100,000; 332,093 deaths, 47.3%). Another significant burden was noticed among adults aged between 75 – 84 years (216,833 deaths, 30.9%; 72.6 per 100,000), which shows that the majority of CVD underlying-cause deaths with P&I mentioned on the death certificate concentrated in older age groups Figure 1.
Age-adjusted mortality by sex, race, and ethnicity
In 2023, the male AAMR was 10.69 per 100,000 compared to 6.73 per 100,000 in females (1999: 37.21 vs 24.97 per 100,000, respectively). In descriptive summaries (1999 – 2020), female deaths were 365,859 (51.9%) and a rate of 8.1 per 100,000, while male deaths were 339,161 (48.1%) with a higher rate of 11.8 per 100,000 (Table 1). All between-group comparisons reported as “#/100,000” reflect age-adjusted rates (AAMRs); crude rates are presented only for within-age-band descriptions Figure 1 and age-group rows in Table 1.
Racial/ethnic distributions (1999 – 2020 descriptive summaries) showed that the largest number of deaths in the country were White decedents (613,213 deaths, 87.0%; 9.5 per 100,000). Black or African American decedents had a higher mortality rate (10.7 per 100,000) with 69,456 deaths (9.9%). Asian or Pacific Islander decedents accounted for 19,078 deaths (2.7%; 7.4 per 100,000), and American Indian or Alaska Native decedents accounted for 3,273 deaths (0.5%; 7.3 per 100,000). By Hispanic origin (1999 – 2020 descriptive summaries), Hispanic or Latino decedents accounted for 39,443 deaths (5.6%; 8.0 per 100,000), while non-Hispanic decedents accounted for 663,895 deaths (94.4%; 9.7 per 100,000) (Table 1). To prevent false precision, 95% CIs (or stability flags where applicable) for subgroup AAMRs, and strata affected by WONDER suppression/instability are explicitly flagged and not over-interpreted.
Place of death
During 1999 – 2020, the majority of CVD underlying-cause deaths with P&I mentioned on the death certificate took place in inpatient medical facilities (419,228 deaths, 59.6%). A large percentage was in the nursing homes/long-term care facilities (178,070 deaths, 25.3%), and 7.1% was at the decedent’s home (50,162 deaths). Fewer were found in the hospice facilities (2.4%) or outpatient/emergency departments (3.2%).
Geographic and urbanization-level variation
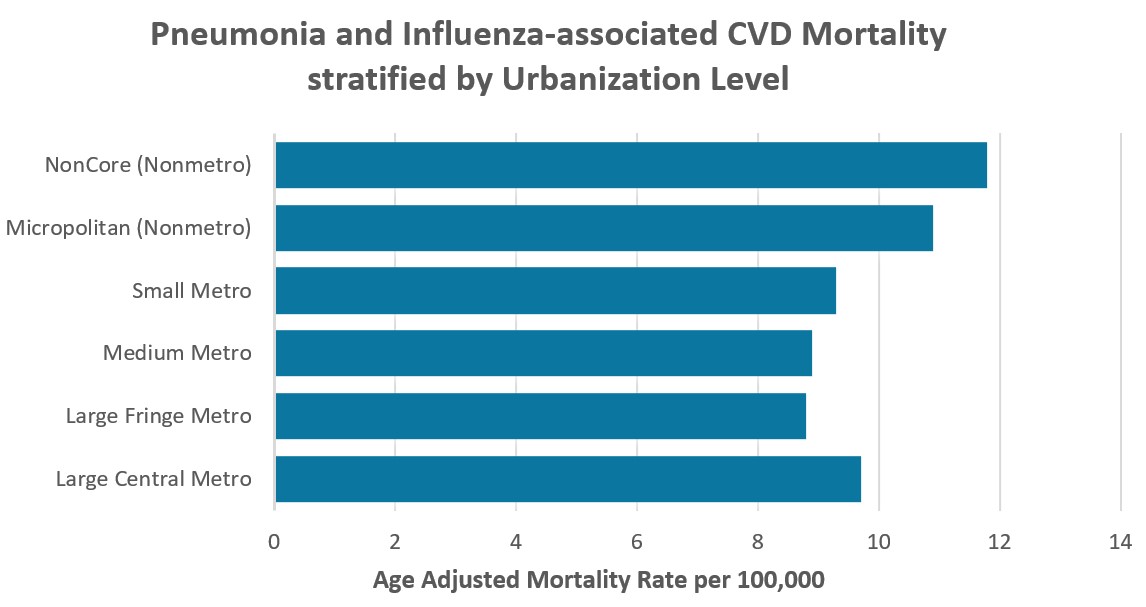
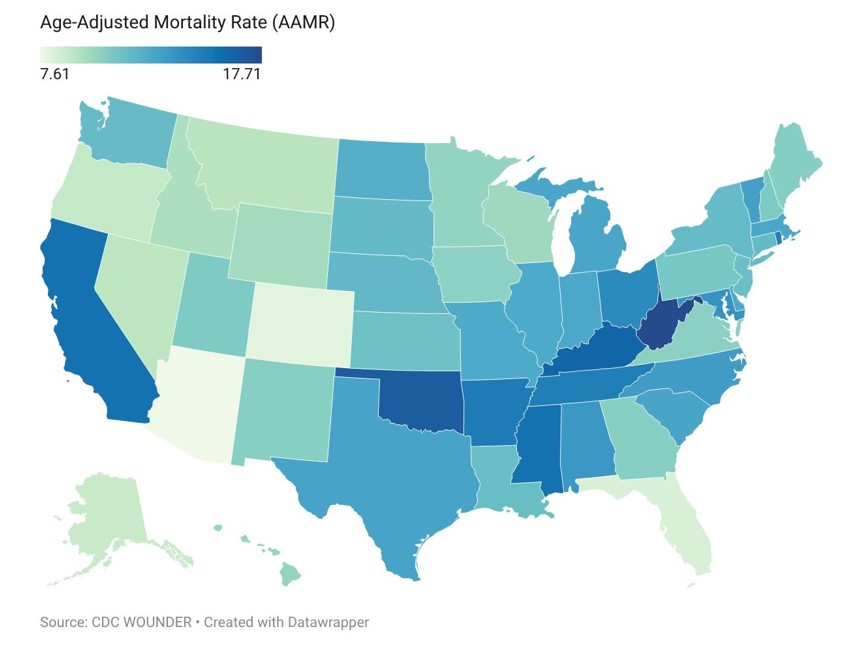
Urbanization studies (1999 – 2020 descriptive summaries) found that the mortality rates were higher in nonmetropolitan areas. AAMR was highest in noncore (nonmetro) areas (11.8 per 100,000), followed by micropolitan (10.9), large fringe metropolitan (8.8), intermediate values in large central metro (9.7), medium metro (8.9), and small metro (9.3) areas Figure 2. State-level age-adjusted mortality rates (AAMR; 1999 – 2020) demonstrated pronounced geographic heterogeneity. Specifically, AAMR ranged from 7.61 per 100,000 in Arizona (lowest) to 17.71 per 100,000 in West Virginia (highest), underscoring substantial interstate variation in CVD deaths with P&I listed as contributing causes Figure 3.
| Characteristics | Category | Deaths | % of Total Deaths | Rate per 100,000 |
|---|---|---|---|---|
| Ten-Year Age Groups | 15-24 years | 696 | 0.10% | 0.1 |
| 25-34 years | 1988 | 0.30% | 0.2 | |
| 35-44 years | 5493 | 0.80% | 0.6 | |
| 45-54 years | 16121 | 2.30% | 1.7 | |
| 55-64 years | 39205 | 5.60% | 5.1 | |
| 65-74 years | 90084 | 12.80% | 17.6 | |
| 75-84 years | 216833 | 30.90% | 72.6 | |
| 85+ years | 332093 | 47.30% | 277.9 | |
| Sex | Female | 365859 | 51.90% | 8.1 |
| Male | 339161 | 48.10% | 11.8 | |
| Race | American Indian or Alaska Native | 3273 | 0.50% | 7.3 |
| Asian or Pacific Islander | 19078 | 2.70% | 7.4 | |
| Black or African American | 69456 | 9.90% | 10.7 | |
| White | 613213 | 87.00% | 9.5 | |
| Hispanic Origin | Hispanic or Latino | 39443 | 5.60% | 8 |
| Not Hispanic or Latino | 663895 | 94.40% | 9.7 | |
| Urbanization | Large Central Metro | 196023 | 27.90% | 9.7 |
| Large Fringe Metro | 152245 | 21.60% | 8.8 | |
| Medium Metro | 139708 | 19.90% | 8.9 | |
| Small Metro | 67706 | 9.60% | 9.3 | |
| Micropolitan (Nonmetro) | 79358 | 11.30% | 10.9 | |
| NonCore (Nonmetro) | 68298 | 9.70% | 11.8 | |
| Place of Death | Medical Facility - Inpatient | 419243 | 59.60% | - |
| Medical Facility - Outpatient or ER | 22431 | 3.20% | - | |
| Medical Facility - Dead on Arrival | 1478 | 0.20% | - | |
| Medical Facility - Status unknown | 974 | 0.10% | - | |
| Decedent’s home | 50187 | 7.10% | - | |
| Hospice facility | 16649 | 2.40% | - | |
| Nursing home/long-term care | 177711 | 25.30% | - | |
| Other | 13087 | 1.90% | - | |
| Place of death unknown | 1578 | 0.20% | - |
AAMRs, age-adjusted mortality rates. Rates (#) are AAMRs, except for age groups, which reflect crude mortality rates. Age-stratified analyses were restricted to decedents aged ≥15 years. Urbanization reflects the NCHS urban–rural classification of the decedent’s county of residence. Place of death is from the CDC WONDER ``Place of Death'' variable and is reported as counts and percentages (no rates). Note: Totals within sections may not equal the overall total because CDC WONDER may suppress small cells and/or code records as ``Unknown/Not stated,'' and these categories are not always displayed as separate rows. Thus, percentages within each section use the section-specific denominator (non-missing/non-suppressed records for that characteristic, unless an ``Unknown/Other'' row is shown).
Overall temporal trends (joinpoint regression)
Joinpoint regression identified three inflection points (2005, 2009, 2019) and four segments: there was a significant drop in mortality in 1999 – 2005 (APC -6.18%, 95% CI -6.97 to -5.38; p<0.000001), followed by an even sharper decline in 2005 – 2009 (APC -10.84%, 95% CI -13.48 to -8.11; p<0.000001), a continuation of this downward trend in 2009 – 2019 (APC -3.72%, 95% CI -4.32 to -3.12; p<0.000001), and a flattening with no statistically significant change of the trend in 2019 – 2023 (APC +0.10%, 95% CI -2.10 to +2.36; p=0.922. The AAPC over the entire duration was -4.94% (95% CI: -5.56 to -4.32; p<0.000001) Figure 4.
Sex-specific trends
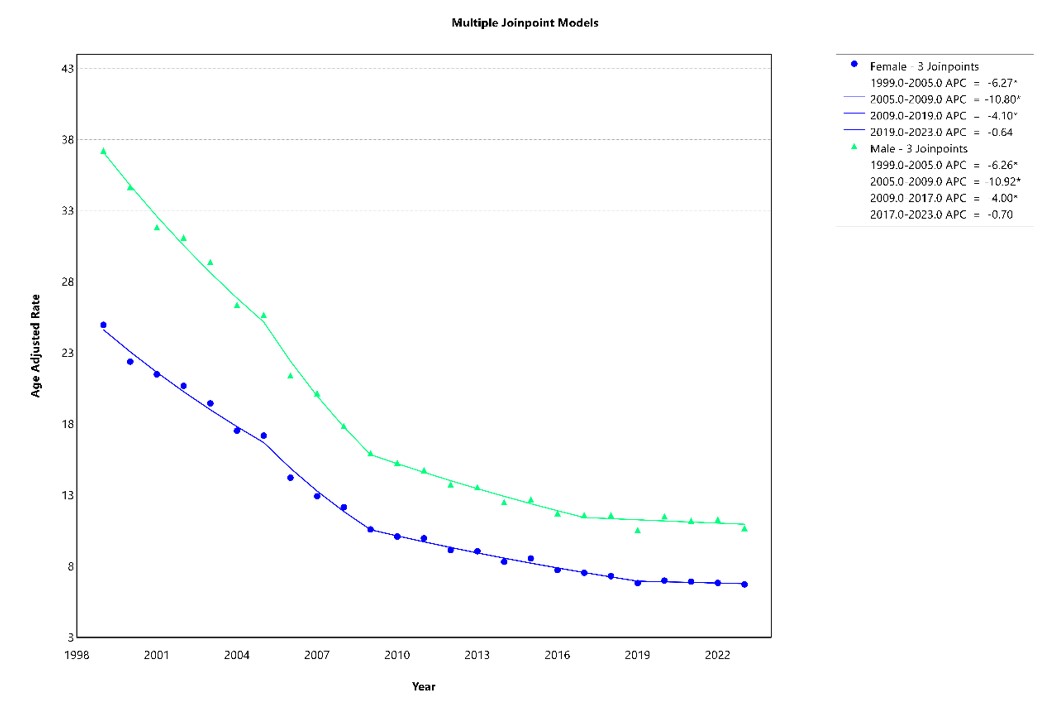
Sex-stratified joinpoint models showed that the patterns were largely similar, with early decline and more recent attenuation; AAMR declined significantly among females in 1999 – 2005 (APC -6.27%), 2005 – 2009 (APC -10.80%), and 2009 – 2019 (APC -4.10%), and then did not change significantly in 2019 – 2023 (APC -0.64%, p=0.612), while mortality declined significantly among males in 1999 – 2005 (APC -6.26%), 2005 – 2009 (APC -10.92%), and 2009 – 2017 (APC -4.00%), and then did not change significantly in 2017 – 2023 (APC -0.70%, p=0.345); AAPC was significantly negative for both females (-5.23%) and males (-4.95%) for the entire period Figure 5.
Race-specific time trends
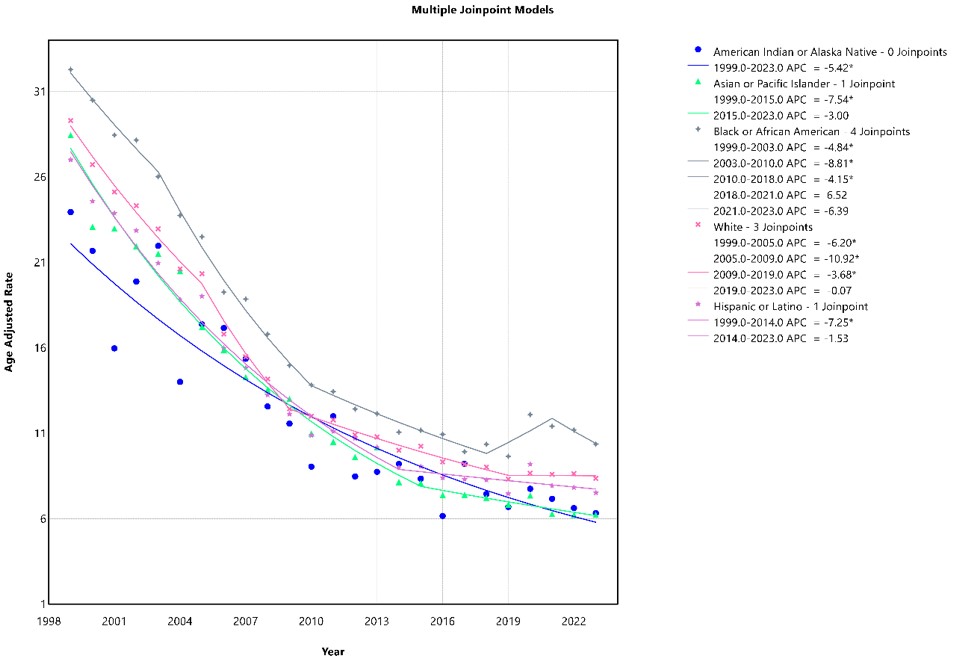
All of the racial/ethnic groups showed statistically significant long-term decline during 1999 – 2023, which were represented by significant full-period AAPCs: American Indian/Alaska Native -5.42%, Asian/Pacific Islander -6.05%, Black or African American -4.58%, White -4.97%, and Hispanic or Latino -5.14% (all p<0.000001).
However, trend patterns varied by group. The mortality of Asian/Pacific Islanders declined sharply from 1999 – 2015 (APC: -7.54%), then continued to decline during 2015 – 2023 (APC: -3.00%, p=0.0013). White mortality improved considerably until the year 2019 (1999 – 2005 APC -6.20%; 2005–2009 APC -10.92%; 2009 – 2019 APC -3.68%) and then plateaued without significant change in 2019 – 2023 (APC -0.07%, p=0.952). Hispanic or Latino mortality declined significantly between 1999 – 2014 (APC -7.25%) with a continued but slower significant decline between 2014–2023 (APC -1.53%, p=0.0436). Mortality of Blacks or African Americans was characterized by several periods of significant decrease until 2018, then a non-significant increase from 2018 – 2021 (APC +6.52%, p=0.145), followed by a non-significant decline from 2021 – 2023 (APC -6.39%, p=0.124), which indicates late-period instability in the trend estimates Figure 6.
Discussion
This was a population-based retrospective study using the CDC WONDER Multiple Cause of Death database to evaluate U.S. national mortality trends from 1999 – 2023, defining CVD as the underlying cause of death (ICD-10 I00 – I99) with P&I listed as a contributing cause (ICD-10 J09 – J18). Over the entire period, 772,865 deaths were certified, with a general downward trend in age-adjusted mortality, which declined from 29.58 to 8.45 per 100,000 (a 71.4% decrease). The trend, however, reached its lowest point in 2019 and flattened during 2019 – 2023, with higher rates in 2020 – 2022, followed by a return to the 2019 level in 2023. Such findings are important, as descriptive co-mention patterns on death certificates: while respiratory infections can trigger sudden cardiovascular events [12], this study does not confirm infection timing or causal triggering and instead identifies groups/periods in which P&I and CVD are co-recorded at death. The recent attenuation/plateau suggests that some high-risk groups may still be missing effective prevention and care, but alternative explanations should also be considered.
The steep drop between 1999 and the mid-2000s, and the subsequent improvement through 2019, are likely due to broader developments in cardiovascular prevention and care in the United States. The mortality burden of CVD may have been decreased during this period by population-level improvements in blood pressure and cholesterol, smoking cessation, and emergency and hospital care of heart attacks and stroke. Meanwhile, improved prevention and treatment of respiratory diseases, such as seasonal influenza and pneumococcal immunization in the elderly and persons with chronic illness, could have helped reduce heart stress due to infections [13].
To our knowledge, no prior study has comprehensively examined these long-term national patterns and disparities in CVD underlying-cause deaths with P&I mentioned on the death certificate. Kwong et al. demonstrated a sharp short-term increase in acute myocardial infarction after laboratory-confirmed influenza, supporting influenza as an acute cardiovascular trigger. However, that design is more concerned with a short-term post-infection risk period and clinical events, not with national patterns of multiple causes of death, long-term trend variations, and geographical/urbanization disparities in deaths in which P&I co-occur with CVD as the underlying cause of death [14]. Likewise, Corrales-Medina et al. found higher short- and long-term risk of incident cardiovascular disease after pneumonia hospitalization in community-based cohorts. However, this approach cannot quantify the frequency of pneumonia/influenza that is recorded as a contributing condition in cardiovascular deaths at the population level, nor can it capture nationwide disparities by race/ethnicity and state, or changes in this pattern since 2019 [15].
One important result is that the previous improvement did not persist after 2019. Many different reasons could explain it. To begin with, the COVID-19 pandemic (2020 – 2022) disrupted routine health care, including preventive appointments and early treatment of acute manifestations, which could have provided an additional opportunity to prevent the emergence of infection and cardiovascular issues in the later stages. Second, a combination of long-term increases in the cardiometabolic risk factors (obesity, diabetes, and hypertension) can predispose people to more severe outcomes if they are diagnosed with pneumonia or influenza [16,17]. Third, mortality patterns might also be influenced by changes in the population exposed and by the severity of respiratory infections, in direct proportion to some settings (such as long-term care facilities). Since the data are based on death certificate coding, there is no record of what factor caused the plateau, but it should be a focus of follow-up research and societal action. In addition, the apparent post-2019 plateau may partly reflect measurement threats, including pandemic-era documentation and coding changes, competing causes (e.g., COVID-19) affecting what is recorded on death certificates, and potential shifts in underlying-cause assignment practices; these factors could bias observed trends independent of true incidence and should be considered when interpreting late-period segmentation.
In 2023, the AAMR was 10.69 per 100,000 in males compared with 6.73 per 100,000 in females (1999: 37.21 vs 24.97 per 100,000, respectively). This male excess in co-mention mortality persisted across the full study period. The observed sex differential is consistent with higher baseline CVD prevalence in men, differences in health behaviors, and differences in preventive care utilization [18,19,20]. However, this descriptive design cannot adjudicate these mechanisms. Males constitute a higher-rate group that may warrant prioritization in further epidemiologic investigation of P&I and CVD co-occurrence.
Descriptive analyses (1999 – 2020) showed that Black or African American decedents had a higher AAMR (10.7 per 100,000) than White decedents (9.5 per 100,000), despite White decedents constituting the numerically larger group. Joinpoint regression identified late-period instability in Black mortality trends after 2018, with non-significant APC fluctuations of +6.52% and -6.39%; these should be interpreted cautiously, as they may reflect small-number instability and pandemic-era coding disruptions rather than a confirmed trend reversal. These racial/ethnic gradients are hypothesis-generating within this descriptive framework and cannot be attributed to specific structural or clinical mechanisms; death-certificate race/ethnicity is also subject to misclassification. Prior literature has identified differential access to cardiovascular preventive services and differences in cardiometabolic comorbidity burden as plausible contributors [21,22], but causal inference is not possible from this design.
Mortality was highest in noncore (nonmetropolitan) areas (AAMR 11.8 per 100,000) and lowest in large fringe metropolitan areas (8.8 per 100,000). State-level rates ranged from 7.61 per 100,000 in Arizona to 17.71 per 100,000 in West Virginia during 1999 – 2020. Because these geographic and urbanization analyses are restricted to the pre-pandemic period, the COVID-19 pandemic and its aftermath may have materially altered care-setting patterns, geographic distributions of mortality, and interstate disparities; these findings should therefore be interpreted as pre-2021 historical context rather than as current estimates of disparities. These geographic gradients are consistent with prior evidence of higher cardiovascular mortality in rural areas [23,24] and are presented as descriptive patterns; crude-rate mapping without covariate adjustment precludes causal inference, and these gradients should be evaluated in follow-up analyses incorporating age-adjusted comparisons with additional ecological covariates.
As anticipated, death rates sharply increased with age. The crude mortality was greatest in adults aged 85 years and above, accounting for almost half of the total number of deaths in the descriptive analysis. This may reflect increased comorbidity burden, reduced immune response, and increased exposure in the long-term care setting [15,25]. A majority of the deaths occurred in inpatient medical facilities, and approximately a quarter in nursing homes or long-term care facilities. These place-of-death patterns are drawn from the 1999 – 2020 descriptive period; the pandemic era is known to have substantially shifted care settings (e.g., increased home and hospice deaths), so these figures should be treated as pre-2021 historical context rather than reflections of current patterns.
On a mechanistic level, the following pathways are provided as context from prior literature and are not adjudicated by death-certificate co-mention data. On a mechanistic level, the contemporary cardiology surveys synthesize the potential of influenza to trigger cardiovascular events by direct cardiac infection, endothelial maladaptation resulting in plaque destabilization and rupture, and systemic mechanisms (hypoxemia, inflammation) that elevate the metabolic load, biomechanical load and hypercoagulability thereby increasing the likelihood that an individual with vulnerable coronary or cerebrovascular disease will move past a clinical endpoint (myocardial infarction, stroke, acute heart failure) during and immediately after infection [26].
In the case of pneumonia, cohort data of large size show that hospitalization for pneumonia is a predictor of short-term and long-term risk of CVD, supporting pneumonia as a clinically relevant risk factor. For instance, the physiologic triad: Hypoxemia + tachycardia/fever + hypotension or adrenergic surge may result in supply-demand mismatch (type 2 myocardial infarction) and exacerbate cardiac failure by increasing afterload/volume changes, as well as trigger ventricular dysfunction due to ischemia in patients with limited cardiac reserve [27,26].
Simultaneously, systemic inflammation facilitates endothelial activation and a prothrombotic state (e.g., heightened coagulation activity and microvascular dysfunction), which offers a pathway between respiratory infection and coronary thrombosis or microvascular ischemia despite the absence of the typical plaque rupture, and these vascular-inflammatory changes are commonly featured in surveys of the cardiovascular complications of influenza [12]. Pneumonia is also highly arrhythmogenic; population data reveal that new-onset atrial fibrillation (AF) after community-acquired pneumonia is associated with increased thromboembolic risk and is not necessarily transient (significant recurrence during follow-up), which is clinically significant because there is another infection-mediated pathway to cardiovascular mortality, AF-related embolic stroke risk [28].
Sepsis-induced cardiomyopathy, where cardiac dysfunction is mediated by a cascade of dysregulated inflammatory mediators, oxidative stress, mitochondrial dysfunction, calcium-handling imbalance, autonomic disruption, and endothelial dysfunction is another significant contributor, particularly in the presence of severe pneumonia with sepsis physiology; this may manifest as reversible global systolic/diastolic depression, and may have a synergistic effect with underlying CVD to increase the risk of short-term mortality [29].
Critically, the long term risk of pneumonia has biologic evidence, although after apparent clinical recovery, a significant percentage of patients are still discharged with evidence of subclinical inflammation, and increased levels of IL-6 and IL-10 which are positively related to subsequent mortality, high IL-6 is specifically related to CVD-related death (among other causes); this supports the hypothesis that the unresolved systemic inflammation is a cause of subsequent mortality and death after a CVD event [30].
Although the mechanistic literature identifies infection-mediated pathways, conventional cardiometabolic risk factors – hypertension, diabetes, and chronic kidney disease – are prevalent among CVD decedents and constitute relevant background for interpreting co-mention patterns. This study cannot quantify the relative contribution of these factors to the observed rates, nor can it evaluate the effect of any specific preventive strategy; such questions require designs with individual-level covariate data and intervention follow-up.
Several limitations warrant consideration. First, death certificate data lack critical individual-level information (e.g., smoking status, body mass index, vaccination status, and medication use), limiting confounding control. Second, cause-of-death coding is imperfect; P&I may be underreported or misclassified on death certificates. Third, as a population-level observational analysis based on co-mentions on death certificates, the study cannot demonstrate that pneumonia or influenza induced particular cardiovascular deaths. Nevertheless, major strengths include the long study period (1999 – 2023) and complete national coverage, enabling robust characterization of long-term trends and subgroup and state-level disparities. Additionally, because analyses were conducted at the annual level, this study does not evaluate within-year seasonal variation in mortality.
Overall, U.S. mortality of CVD underlying-cause deaths with P&I mentioned on the death certificate decreased strongly in the period between 1999 and 2019 but was followed by a plateau in 2019 – 2023, with a slight increase observed in 2020 – 2022. Older adults, males, nonmetropolitan, and selected racial/ethnic groups continued to have a higher mortality rate. These results describe co-mention patterns in CVD underlying-cause deaths and identify higher-rate groups/areas for prioritization of prevention planning and further investigation, while recognizing measurement limitations and alternative explanations for late-period trends. These results justify reinforcing cardiovascular prevention and infection prevention strategies as components of heart-health approaches, in particular among older adults and individuals with established CVD. These descriptive patterns suggest areas for prioritization in prevention planning and future research to connect mortality with patient-specific clinical data (vaccination, comorbidities) and the effectiveness of access to short- and long-term care with the environment, and test interventions that may decrease the post-infection cardiovascular complications.
Conclusion
This comprehensive 25-year analysis describes mortality trends in CVD underlying-cause deaths with P&I mentioned on the death certificate in the United States. The findings demonstrate a marked reduction in deaths, with overall AAMR declining by nearly 5% per year from 1999 to 2023. A recent stabilization in mortality rates was observed in the late period, which descriptively identifies a potential plateau and highlights high-rate groups/areas that may warrant prioritization for further investigation and prevention planning. Both males and females have benefited from improvements, with females showing a greater decline. However, some disparities across racial and ethnic groups persist, with non-Hispanic Black or African American populations showing the smallest overall decline and greater late-period uncertainty/volatility in trend estimates.
These observed differences should be interpreted cautiously, as they may reflect variation in death-certificate coding practices, suppression/instability in small strata, pandemic-era documentation changes, and unmeasured structural confounding that cannot be addressed in this descriptive design. Future research should evaluate plausible mechanisms using designs that can better adjudicate timing and causality, rather than inferring triggering pathways from co-mention data. Ultimately, our findings provide descriptive surveillance of co-mention patterns over time and geography and should be used to motivate and prioritize confirmatory epidemiologic and health-systems research rather than to claim intervention effects. Next-step analyses will include separating influenza (J09 – J11) from pneumonia (J12 – J18), stratifying by CVD subtypes (e.g., ischemic heart disease, stroke, heart failure).
Conflicts of Interest
The authors declare no competing interests that could have influenced the objectivity or outcome of this research.
Funding Source
This research did not receive any specific grant from funding agencies in the public, commercial, or not-for-profit sectors.
Acknowledgments
The authors have no acknowledgments to declare.
Institutional Review Board (IRB)
Not applicable. This study used publicly available, de-identified data; IRB approval and informed consent were not required.
Large Language Model
No generative artificial intelligence (AI) tools or services were used in the preparation or editing of this manuscript. The authors take full responsibility for the content of this publication.
Authors Contribution
Conceptualization was carried out by MB and AZ, while methodology and data curation were handled by MB, AZ, and MMA. The software and formal analysis were performed by AZ, MMA, and MB, and visualization was completed by AZ and MMA. Investigation involved MB, AZ, and MMA. The original draft was written by AAB, ASI, MAB, AMS, and AMB, while all authors contributed to reviewing and editing the manuscript. Supervision and project administration were led by MB, and all authors contributed to resources and validation.
Data Availability
All data used in this study are publicly available. U.S. multiple-cause-of-death mortality data (1999–2023) were obtained from the CDC WONDER Multiple Cause of Death database (accessed October 2025). Deaths were identified with cardiovascular disease (CVD) as the underlying cause of death (ICD-10 codes I00–I99) and pneumonia and influenza (P&I) listed as contributing causes (ICD-10 codes J09–J18), where P&I was mentioned anywhere on the death certificate in conjunction with a cardiovascular diagnosis. These data can be queried and downloaded directly from CDC WONDER, and no individual-level or identifiable information was used. Aggregated analysis-ready annual series (including deaths, denominators, and age-adjusted mortality rates by subgroup) used to generate the figures are provided in the Supplementary Data file.
References
- Tejada-Vera B., Bastian B. A., Curtin S. C.. Deaths: Leading Causes for 2023. Natl Vital Stat Rep. 2025:1. doi:10.15620/cdc/174607 PMID: 41021892 PMCID: PMC12498176
- Flu Season | Influenza (Flu) | CDC [Internet]. 2026.
- Hansen C. L., Chaves S. S., Demont C., Viboud C.. Mortality Associated With Influenza and Respiratory Syncytial Virus in the US, 1999-2018. JAMA Netw Open. 2022;5(2):e220527. doi:10.1001/jamanetworkopen.2022.0527 PMID: 35226079 PMCID: PMC8886548
- Mohammad M. A., Tham J., Koul S., Rylance R., Bergh C., Erlinge D., Frobert O.. Association of acute myocardial infarction with influenza: A nationwide observational study. PLoS One. 2020;15(8):e0236866. doi:10.1371/journal.pone.0236866 PMID: 32760080 PMCID: PMC7410234
- Gopal R., Marinelli M. A., Alcorn J. F.. Immune Mechanisms in Cardiovascular Diseases Associated With Viral Infection. Front Immunol. 2020;11:570681. doi:10.3389/fimmu.2020.570681 PMID: 33193350 PMCID: PMC7642610
- Corrales-Medina V. F., Suh K. N., Rose G., Chirinos J. A., Doucette S., Cameron D. W., Fergusson D. A.. Cardiac complications in patients with community-acquired pneumonia: a systematic review and meta-analysis of observational studies. PLoS Med. 2011;8(6):e1001048. doi:10.1371/journal.pmed.1001048 PMID: 21738449 PMCID: PMC3125176
- Pieralli F., Vannucchi V., Nozzoli C., Augello G., Dentali F., De Marzi G., Uomo G., Risaliti F., Morbidoni L., Mazzone A., Santini C., Tirotta D., Corradi F., Gerloni R., Gnerre P., Gussoni G., Valerio A., Campanini M., Manfellotto D., Fontanella A., FADOI-ICECAP Study Group. Correction to: Acute cardiovascular events in patients with community acquired pneumonia: results from the observational prospective FADOI-ICECAP study. BMC Infect Dis. 2021;21(1):195. doi:10.1186/s12879-021-05891-5 PMID: 33607965 PMCID: PMC7893753
- CDC. Multiple Cause of Death 1999-2020 [Internet].
- O'Halloran A. C., Holstein R., Cummings C., Daily Kirley P., Alden N. B., Yousey-Hindes K., Anderson E. J., Ryan P., Kim S., Lynfield R., McMullen C., Bennett N. M., Spina N., Billing L. M., Sutton M., Schaffner W., Talbot H. K., Price A., Fry A. M., Reed C., Garg S.. Rates of Influenza-Associated Hospitalization, Intensive Care Unit Admission, and In-Hospital Death by Race and Ethnicity in the United States From 2009 to 2019. JAMA Netw Open. 2021;4(8):e2121880. doi:10.1001/jamanetworkopen.2021.21880 PMID: 34427679 PMCID: PMC8385599
- Donaldson S. V., Thomas A. N., Gillum R. F., Mehari A.. Geographic Variation in Racial Disparities in Mortality From Influenza and Pneumonia in the United States in the Pre-Coronavirus Disease 2019 Era. Chest. 2021;159(6):2183-2190. doi:10.1016/j.chest.2020.12.029 PMID: 33400931
- Holland E., Jabbar A. B. A., Asghar M. S., Asghar N., Mistry K., Mirza M., Tauseef A.. Demographic and regional trends of pneumonia mortality in the United States, 1999 to 2022. Sci Rep. 2025;15(1):10103. doi:10.1038/s41598-025-94715-6 PMID: 40128337 PMCID: PMC11933369
- Smeeth L., Thomas S. L., Hall A. J., Hubbard R., Farrington P., Vallance P.. Risk of myocardial infarction and stroke after acute infection or vaccination. N Engl J Med. 2004;351(25):2611-8. doi:10.1056/NEJMoa041747 PMID: 15602021
- Ananth C. V., Brandt J. S., Keyes K. M., Graham H. L., Kostis J. B., Kostis W. J.. Epidemiology and trends in stroke mortality in the USA, 1975-2019. Int J Epidemiol. 2023;52(3):858-866. doi:10.1093/ije/dyac210 PMID: 36343092 PMCID: PMC10244057
- Kwong J. C., Schwartz K. L., Campitelli M. A., Chung H., Crowcroft N. S., Karnauchow T., Katz K., Ko D. T., McGeer A. J., McNally D., Richardson D. C., Rosella L. C., Simor A., Smieja M., Zahariadis G., Gubbay J. B.. Acute Myocardial Infarction after Laboratory-Confirmed Influenza Infection. N Engl J Med. 2018;378(4):345-353. doi:10.1056/NEJMoa1702090 PMID: 29365305
- Corrales-Medina V. F., Alvarez K. N., Weissfeld L. A., Angus D. C., Chirinos J. A., Chang C. C., Newman A., Loehr L., Folsom A. R., Elkind M. S., Lyles M. F., Kronmal R. A., Yende S.. Association between hospitalization for pneumonia and subsequent risk of cardiovascular disease. JAMA. 2015;313(3):264-74. doi:10.1001/jama.2014.18229 PMID: 25602997 PMCID: PMC4687729
- Huang D., He D., Gong L., Wang W., Yang L., Zhang Z., Shi Y., Liang Z.. Clinical characteristics and risk factors associated with mortality in patients with severe community-acquired pneumonia and type 2 diabetes mellitus. Crit Care. 2021;25(1):419. doi:10.1186/s13054-021-03841-w PMID: 34876193 PMCID: PMC8650350
- Zhao X., Gang X., He G., Li Z., Lv Y., Han Q., Wang G.. Obesity Increases the Severity and Mortality of Influenza and COVID-19: A Systematic Review and Meta-Analysis. Front Endocrinol (Lausanne). 2020;11:595109. doi:10.3389/fendo.2020.595109 PMID: 33408692 PMCID: PMC7779975
- Marma A. K., Lloyd-Jones D. M.. Systematic examination of the updated Framingham heart study general cardiovascular risk profile. Circulation. 2009;120(5):384-90. doi:10.1161/CIRCULATIONAHA.108.835470 PMID: 19620502
- Towfighi A., Markovic D., Ovbiagele B.. Current national patterns of comorbid diabetes among acute ischemic stroke patients. Cerebrovasc Dis. 2012;33(5):411-8. doi:10.1159/000334192 PMID: 22456491
- Vaidya V., Partha G., Karmakar M.. Gender differences in utilization of preventive care services in the United States. J Womens Health (Larchmt). 2012;21(2):140-5. doi:10.1089/jwh.2011.2876 PMID: 22081983
- Lackland D. T., Roccella E. J., Deutsch A. F., Fornage M., George M. G., Howard G., Kissela B. M., Kittner S. J., Lichtman J. H., Lisabeth L. D., Schwamm L. H., Smith E. E., Towfighi A., American Heart Association Stroke Council, Council on Cardiovascular and Stroke Nursing, Council on Quality of Care and Outcomes Research, Council on Functional Genomics and Translational Biology. Factors influencing the decline in stroke mortality: a statement from the American Heart Association/American Stroke Association. Stroke. 2014;45(1):315-53. doi:10.1161/01.str.0000437068.30550.cf PMID: 24309587 PMCID: PMC5995123
- Matthews K. A., Spears K. S., Anderson-Lewis C.. Rural Health Disparities: Contemporary Solutions for Persistent Rural Public Health Challenges. Prev Chronic Dis. 2025;22:E27. doi:10.5888/pcd22.250202 PMID: 40539904 PMCID: PMC12199730
- Golembiewski E. H., Gravholt D. L., Torres Roldan V. D., Lincango Naranjo E. P., Vallejo S., Bautista A. G., LaVecchia C. M., Patten C. A., Allen S. V., Jaladi S., Boehmer K. R.. Rural Patient Experiences of Accessing Care for Chronic Conditions: A Systematic Review and Thematic Synthesis of Qualitative Studies. Ann Fam Med. 2022;20(3):266-272. doi:10.1370/afm.2798 PMID: 35606138 PMCID: PMC9199043
- Smith C. L., Bednarchik B., Aung H., Wilk D. J., Boxer R. S., Daddato A. E., Wilson B. M., Gravenstein S., Canaday D. H.. Humoral and Cellular Immunity Induced by Adjuvanted and Standard Trivalent Influenza Vaccine in Older Nursing Home Residents. J Infect Dis. 2023;228(6):704-714. doi:10.1093/infdis/jiad071 PMID: 36951196
- Thomas R. E.. Reducing Morbidity and Mortality Rates from COVID-19, Influenza and Pneumococcal Illness in Nursing Homes and Long-Term Care Facilities by Vaccination and Comprehensive Infection Control Interventions. Geriatrics (Basel). 2021;6(2). doi:10.3390/geriatrics6020048 PMID: 34066781 PMCID: PMC8162358
- Skaarup K. G., Modin D., Nielsen L., Jensen J. U. S., Biering-Sorensen T.. Influenza and cardiovascular disease pathophysiology: strings attached. Eur Heart J Suppl. 2023;25(Suppl A):A5-A11. doi:10.1093/eurheartjsupp/suac117 PMID: 36937370 PMCID: PMC10021500
- Kalantar Neyestanaki Mohammad Hassan, Kalantar Neyestanaki Majid. Influenza and its cardiovascular complications: a comprehensive review. Acta Angiologica. 2024;30(2):69-78. doi:10.5603/aa.99211
- Sogaard M., Skjoth F., Nielsen P. B., Smit J., Dalager-Pedersen M., Larsen T. B., Lip G. Y. H.. Thromboembolic Risk in Patients With Pneumonia and New-Onset Atrial Fibrillation Not Receiving Anticoagulation Therapy. JAMA Netw Open. 2022;5(5):e2213945. doi:10.1001/jamanetworkopen.2022.13945 PMID: 35616941 PMCID: PMC9136621
- Liu Y. C., Yu M. M., Shou S. T., Chai Y. F.. Sepsis-Induced Cardiomyopathy: Mechanisms and Treatments. Front Immunol. 2017;8:1021. doi:10.3389/fimmu.2017.01021 PMID: 28970829 PMCID: PMC5609588
- Yende S., D'Angelo G., Kellum J. A., Weissfeld L., Fine J., Welch R. D., Kong L., Carter M., Angus D. C., Gen I. M. S. Investigators. Inflammatory markers at hospital discharge predict subsequent mortality after pneumonia and sepsis. Am J Respir Crit Care Med. 2008;177(11):1242-7. doi:10.1164/rccm.200712-1777OC PMID: 18369199 PMCID: PMC2720087