Mortality Trends and Disparities in Hypertensive Heart and Renal Disease: A 25-Year Analysis (1999–2023) Using the CDC WONDER Database
Ahmad JalilⒾ1*, Fatima RajabⒾ2, Bisal Naseer2, Aleena Mujahid2, Mohsan Ali2, Hadia Rajab3, Justin May4
- 1Baptist Memorial Hospital, Oxford, Mississippi, United States
- 2King Edward Medical University, Lahore, Pakistan
- 3University of Lahore, Lahore, Pakistan
- 4Baptist Memorial Hospital, Oxford, Mississippi, United States
Abstract
Background: Hypertensive heart and renal disease remain major contributors to mortality in the United States. Tracking long-term mortality patterns is essential for identifying high-risk populations and guiding public health strategies.
Methods: We conducted a nationwide ecological time-trend analysis using CDC WONDER underlying cause-of-death data for Hypertensive Heart and Renal Disease (ICD-10 I13) from 1999–2023. Age-adjusted mortality rates (AAMR) for all ages were examined by sex, race/ethnicity, census region, and urbanization level. Temporal changes were assessed using joinpoint regression with annual percent change (APC) and average annual percent change (AAPC).
Results: AAMR increased from 1.2 (95% CI: 1.2–1.3) per 100,000 in 1999 to 4.2 (95% CI: 4.2–4.3) in 2023. After relative stability in the early years, a marked rise began around 2011, with the South and Midwest showing the steepest increases. From 2013–2023, the AAPC was not statistically significant for females (AAPC = 6.26%; p = 0.1678) but was significant for males (AAPC = 10.67%; p = 0.000117). Males(with AAMR of 4.7 vs 3.9 in females in 2023), older adults, and Black individuals consistently exhibited the highest mortality, while American Indian or Alaska Native groups experienced the most rapid recent increases. A modest decline from 2021–2023 was observed; potential explanations include shifts in healthcare access, reporting, or coding practices.
Conclusions: Rising mortality from hypertensive heart and renal disease from 1999 to 2023 highlights persistent demographic and geographic disparities requiring targeted interventions. Keywords: Hypertensive heart disease; Renal disease; Mortality trends; Age-adjusted mortality; Health disparities
Keywords: Hypertensive heart disease, Renal disease, Mortality trends, Age-adjusted mortality, Health disparities
Article information
Introduction
Hypertension, with a high prevalence of exposure, is the strongest risk factor for cardiovascular disease (CVD), which is the leading cause of mortality and morbidity in the United States [1,2]. Hypertension is defined as systolic blood pressure greater than 130 mm of Hg and diastolic blood pressure greater than 80 mm of Hg [3]. According to an analysis, the prevalence of hypertension was nearly 48% in the US during August 2021-August 2023. It remains above the target goal of Healthy People 2030, raising health concerns [4,5]. Based on several cohort studies, this epidemic is a significant risk factor for several conditions like atrial fibrillation, cerebrovascular diseases, heart failure, coronary heart disease, aortic syndromes ,chronic kidney disease, and dementia [1].
Hypertension mediated organ damage (HMOD) like hypertensive heart and renal disease is more common among people with long standing or severe hypertension but asymptomatic population or people with less severe hypertension also suffer from these complications [6,7].
While delving deep into the pathophysiological mechanism behind these complications, it is found that left ventricular hypertrophy is the earliest manifestation of hypertensive heart disease and it progresses to other complications like heart failure and end stage renal disease (ESRD) [8,1].Similarly, hypertension also damages the renal microvasculature directly due to high pressure transmission resulting in fibrosis and hypertensive renal disease [9].
Based on our analysis of the Centres For Disease Control and Prevention Wide-Ranging OnLine Data for Epidemiological Research (CDC WONDER) database, the mortality rates in the US due to combined hypertensive heart and renal disease have increased in the last two decades with the age-adjusted mortality rates (AAMR) of 4.2 ( 95% CI 4.2 to 4.3) per 100,000 population in 2023 with 17,623 deaths due hypertensive heart and renal disease [10]. Several studies have shown higher mortality rates in men and younger adults due to hypertensive heart disease and in African Americans and populations in the West and metropolitan areas of the US due to hypertensive renal disease [11,12]. These trends in mortality rates warrant further research into several contributing factors. Therefore, this study aims to examine nationwide trends and disparities in ICD-10–coded mortality due to hypertensive heart and renal disease (I13) in the United States from 1999 to 2023, with specific focus on variations by gender, race, age group, and geographic region. This analysis of variations and temporal trends is valuable for the development of effective hypertensive heart and renal disease management strategies.
Methods
Study setting and population
In this nationwide ecological time-trend analysis, an in-depth search was conducted on Hypertensive Heart and Renal Disease in the US population from 1999 to 2023 and death certificate based data were retrieved from CDC WONDER underlying cause of death for all ages. The study used the diagnostic codes from the 10th version of the International Classification of Diseases and Related Health Problems (ICD-10) including I13 for “Hypertensive Heart and Renal Disease”. This data set has been used by previous studies for mortality analysis of cardiovascular diseases and their complications. Information from death certificates from all 50 states and the District of Columbia is used in this collection [10]. This study used deidentified data from government-issued public use data set, therefore, this research did not necessitate an approval from local institutional review board. It follows the Strengthening the Reporting of Observational Studies in Epidemiology (STROBE) guidelines for reporting.
Data Abstraction
This data set included year, population size, demographic characteristics, urban-rural classification, geographical segmentation, and location of death, including hospitals, nursing homes, long-term care facilities, households, and hospices. The demographics included age, race, and gender. Race (any ethnicity) was classified as White, Black or African American, American Indian or Alaskan Native, and Asian or Pacific Islander. Hispanic individuals of any race were analyzed as a separate group. This collection was retrieved from CDC WONDER. [10]. The population was assessed in urban and rural counties per the 2013 U.S. census classification in accordance with the National Center for Health Statistics Urban-Rural Classification Scheme to all study years (1999–2023) to ensure consistency in county categorization and comparability across the full analysis period [13]. According to the United States Census Bureau, geographical categories included West, Northeast, South, and Midwest [14]. Mortality rates were analyzed using two age groups, <65 years and ≥65 years, to reflect the markedly higher concentration of cardiovascular and renal risk in older adults. For clearer temporal assessment, year-interval groupings were organized into 5-year blocks (e.g., 1999–2003, 2004–2008). Place-of-death and urbanization analyses were restricted to 1999–2020, reflecting the last year for which these variables were available in the CDC WONDER database.
Statistical Analysis
We used crude death rates and AAMRs per 100,000 from 1999 to 2023 from CDC WONDER to examine the trend. These rates were further divided into groups based on gender, year, age, race, and State. 95% confidence intervals (CI) were included. We obtained AAMR directly from CDC WONDER (2000 U.S. standard population) [15]. Crude mortality rates were calculated by dividing the number of deaths caused by Hypertensive Heart and Renal Disease by the corresponding US population of that year. Annual Percent Change (APC) with 95% confidence intervals was calculated using the Joinpoint Regression Program (Joinpoint V 5.3.0.0, National Cancer Institute) [16]. A log-linear, weighted model was used to identify statistically significant changes in mortality trends. Using two-tailed testing, APC estimates were considered increasing or decreasing when the slope differed significantly from zero, with a p-value < 0.05 denoting statistical significance. The final model allowed up to three joinpoints. Missing or unknown values were excluded for analysis of cohorts.
Results
The AAMR due to hypertensive heart and renal disease has increased from 1.2 (95% CI=1.2 to 1.3) in 1999 to 4.2 (95% CI = 4.2 to 4.3) in 2023 with a total number of 148,337 deaths from 1999 to 2023. From 1999 to 2011, it remained relatively stable; however an increasing trend in AAMR was noted during the next 12 years, with a relatively sharp increase from 2017 to 2020. The South and Midwest experienced the sharpest increases in mortality rates, particularly in the last decade. Males showed a statistically significant upward trend in mortality rates, while the increase for females was less consistent and not statistically significant. Significant increases were observed across Hispanic ethnicity, and among races including White, Black, and Asian populations in recent years, with particularly rapid increases in the American Indian or Alaska Native population from 2014 to 2023.
Gender stratification
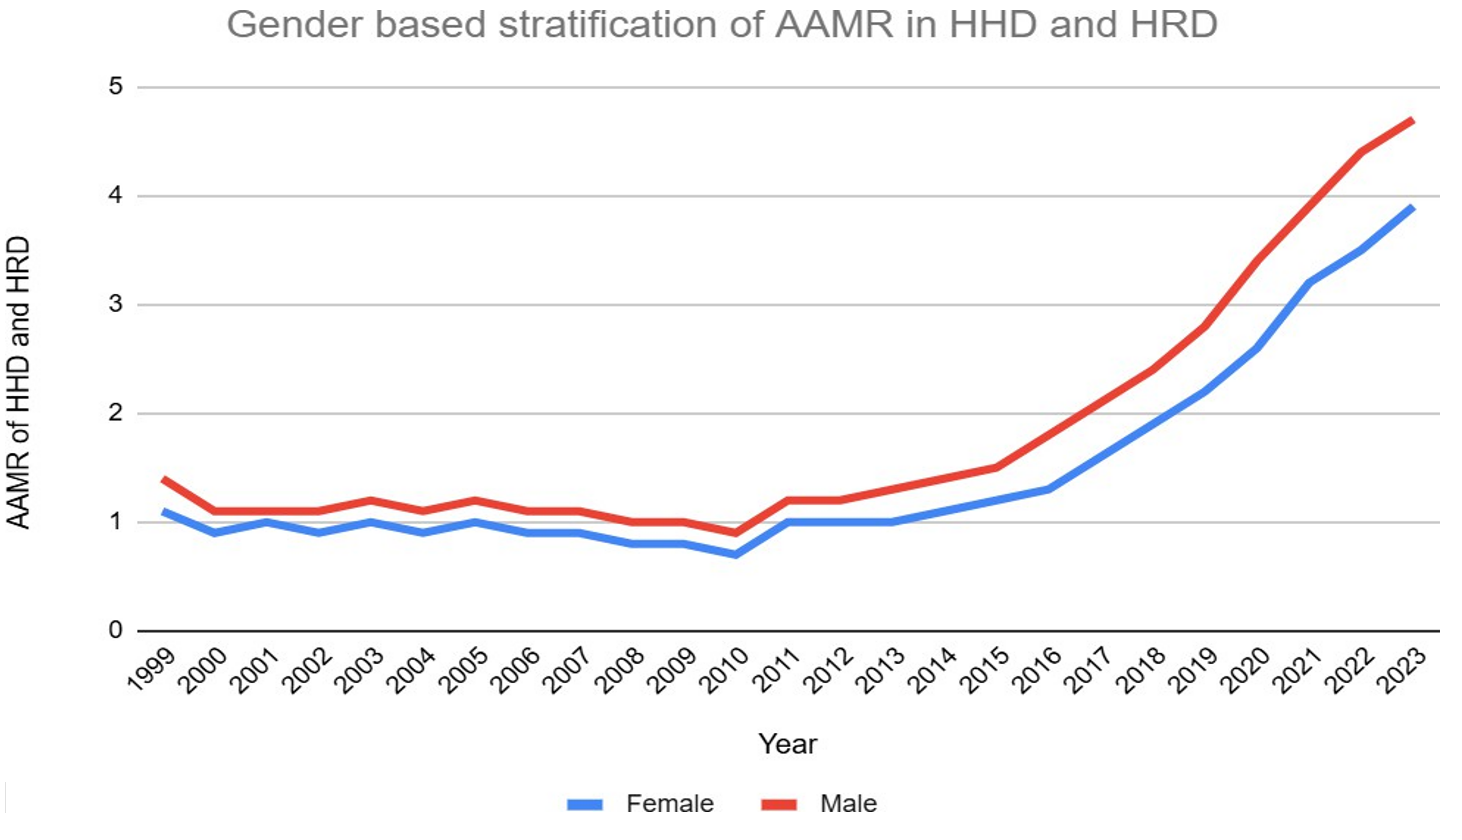
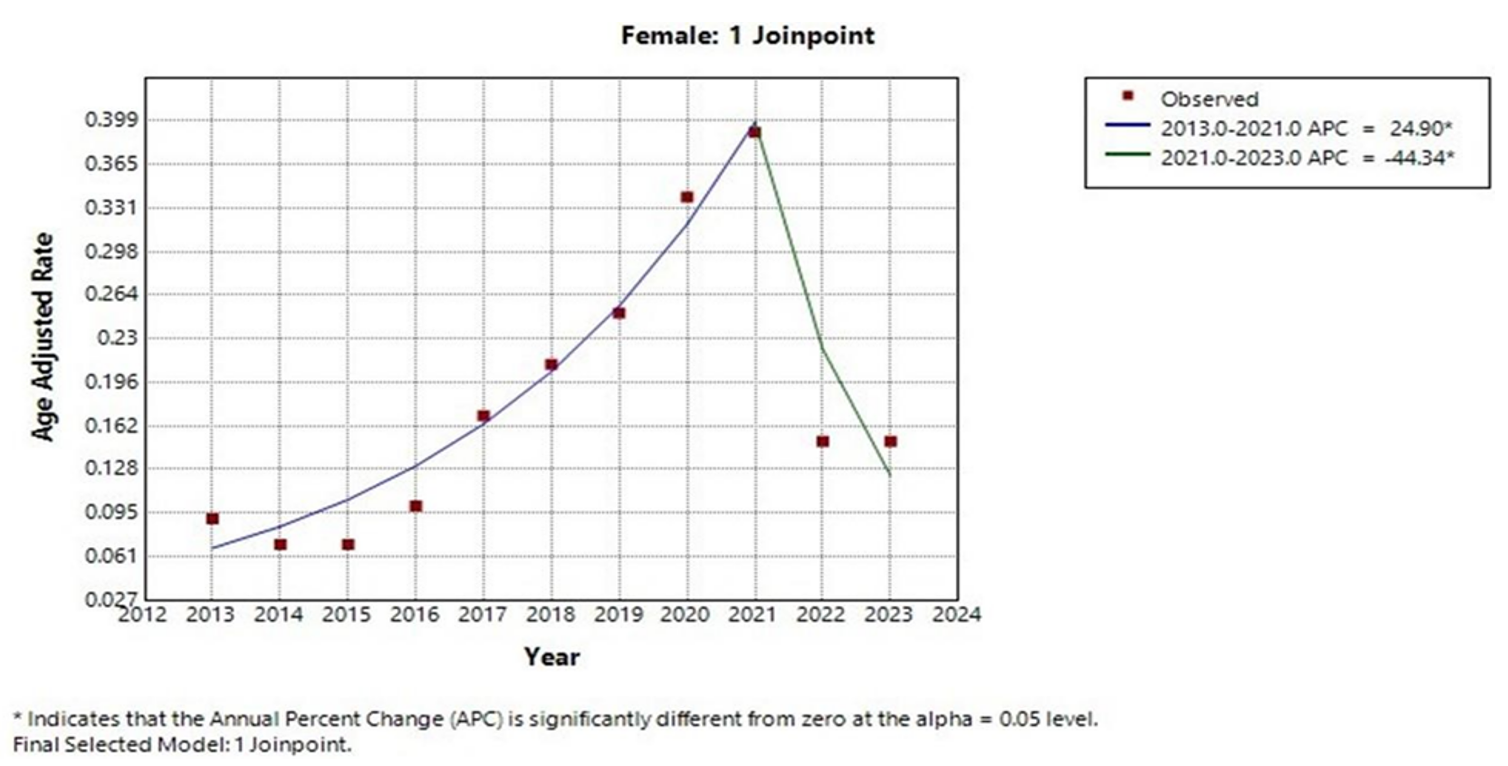
From 1999 to 2023, men had consistently higher mortality rates as compared to women as shown in Figure 1. For females, the rate began at 1.1 in 1999, reaching 3.9 by 2023 as given in Supplementary Table S1. Their AAMR increased significantly from 2013 to 2021 (APC = 24.9, 95% CI = 17.95 to 32.25, p < 0.001) and then there was a period of decline from 2021 to 2023 (APC = -44.34, 95% CI = -65.8 to -9.4, p = 0.03) as shown in Supplementary Table S2. Despite a statistically significant incline in AAMR from 2013 to 2021, the trend for overall AAPC from 2013 to 2023 was not statistically significant for females (AAPC = 6.26%, 95% CI = -2.52 to 15.83, p = 0.17) as shown in Figure 2.
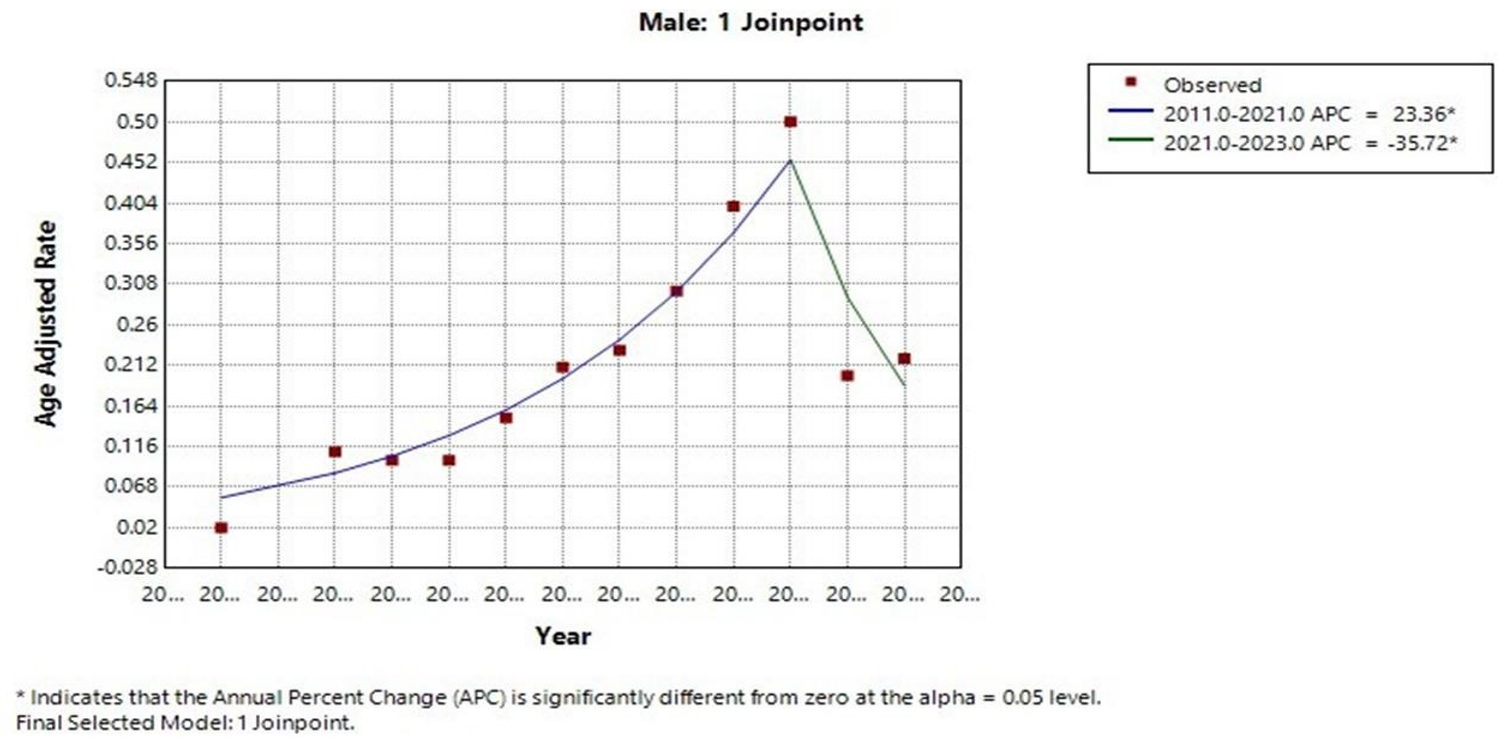
For males, the mortality rate started higher, at 1.4 in 1999, reaching to 4.7 in 2023 as shown in Supplementary Table S1. Their AAMR increased significantly from 2011 to 2021 (APC = 23.36, 95% CI = 17.64 to 29.37, p < 0.001) and then there was a period of decline from 2021 to 2023 (APC = -35.72, 95% CI = -51.79 to -14.29, p = 0.01) as shown in Supplementary Table S2. This trend of increasing mortality was statistically significant for males from 2011 to 2023 (AAPC = 10.67%, 95%CI = 5.1 to 16.5, p < 0.001) as shown in Figure 3.
Racial stratification
The racial trends for hypertensive heart and renal disease, shown in Figure 4, demonstrate the highest mortality rates for Black individuals with their APC shown in Supplementary Table S3. For American Indian or Alaska Native, a notable increase in mortality was observed from 2014 to 2021, with an APC of 22.22 (95% CI = 13.81 to 23.26) and APC of 6.93 from 2021 to 2023. Overall, AAPC from 2014 to 2023 was 18.44 (95% CI = 13.81 to 23.26, p < 0.001).
For Black individuals, from 1999 to 2010, there was a decrease in mortality rates (APC = -3.46, 95% CI = -4.78 to -2.1, p < 0.001). However, from 2010 to 2015, APC shifted to 3.2 (95% CI= -4.11 to 11.08, p = 0.38) and from 2015 to 2023, it shifted to 10.43 (95% CI = 8.7 to 12.18) reflecting a positive trend and a significant increase in mortality for this group. Overall, the trend of increased mortality from 1999 to 2023 was statistically significant (AAPC = 2.38, 95% CI = 0.74 to 4.05, p = 0.01).
For Asian or Pacific Islander, a negative APC of -3.48 (95% CI = -5.51 to -1.40, p < 0.001) was observed from 1999 to 2010, followed by an increase in mortality from 2010 to 2023, where the APC reached 6.92 (95% CI = 5.71 to 8.14, p < 0.001). Overall, the trend of increased mortality from 1999 to 2023 was statistically significant (AAPC = 2.02, 95% CI = 0.92 to 3.13, p < 0.001)
For White individuals, the mortality trend showed a decline from 1999 to 2009 (APC = -1.79, 95% CI = -3.08 to -0.47, p = 0.01), followed by a significant increase after 2009. From 2009 to 2015, the APC was 7.19 (95% CI = 3.46 to 11.04, p < 0.001) and from 2015 to 2021, the APC surged to 20.52(95% CI= 18.57 to 22.50), showing a major upward trend with a very significant p < 0.001. This continued into 2023, with an APC of 10.55 (95% CI = 6.71 to 14.51, p < 0.001), confirming that mortality rates for Whites have been increasing rapidly in recent years. Overall, the trend of increased mortality from 1999 to 2023 was statistically significant (AAPC = 6.7, 95% CI = 5.58 to 7.83, p < 0.001)
When stratified based on ethnicity, Hispanics had the APC from 1999 to 2010 was -2.67 (95% CI = -4.75 to -0.54, p = 0.02), suggesting a decrease in mortality during that period. However, from 2010 to 2020, the APC increased to 9.42 ( 95% CI = 7.60 to 11.25, p < 0.001) indicating a recent upward trend in mortality for this group. Overall, the trend of increased mortality from 1999 to 2020 was statistically significant (AAPC = 2.9, 95% CI = 1.6 to 4.2, p < 0.001)
Mortality trends by census regions
The AAMR show significant regional variation over the years from 1999 to 2023 as shown in Figure 5and Supplementary Table S4. In the Northeast, the AAMR started at 0.9 in 1999 and saw an increase, reaching 2.4 by 2023. This represents a steady upward trend over the 25 years. In the Midwest, the rate began at 1.1 in 1999, with fluctuations until 2020, when it spiked to 3.1. By 2023, the rate had increased to 4.6, reflecting a strong upward trajectory, particularly in the last decade. The South experienced a similar pattern, starting at 1.5 in 1999. The rate remained relatively stable at 1.2 throughout much of the early 2000s but began rising significantly from 2015 onwards, reaching 5.5 by 2023. This indicates a sharp increase in mortality rates, especially in the last 8 years. In the West, the AAMR began at 1.3 in 1999 and saw less fluctuation compared to the other regions. The rate gradually increased to 3.4 by 2023, with steady growth over the years.
Urbanization trends
From 1999 to 2020, mortality rates for hypertensive heart and renal diseases generally increased across various levels of urbanization as shown in Supplementary Table S5. In large central metropolitan areas, the rate increased to 2.9 in 2020 from 1.4 in 1999. Similarly, large fringe metropolitan areas saw a rise from 1.0 to 2.4 over the same period. Medium metro areas experienced a steady increase, climbing from 1.3 to 3.5, while small metro areas moved from 1.1 to 3.1. Similarly, rural areas such as micropolitan and noncore regions experienced increases, with micropolitan areas rising from 1.2 to 3.3 and noncore regions moving from 1.1 to 3.1. These trends, shown in Figure 6, highlight that while mortality rates have been rising across all areas.
Place of Death
Analyzing the number of deaths from 1999 to 2020, shown in Table 1, the maximum number of deaths took place in the decedent’s home followed by nursing homes, inpatient facilities, and outpatient settings. Other places of death, such as hospice facilities settings accounted for a smaller proportion of total deaths. These figures reflect simple distributions and do not indicate rates or relative risk.
| Place of Death | Number of Deaths |
|---|---|
| Decedent’s home | 32,813 |
| Nursing home/long-term care | 25,208 |
| Medical facility–Inpatient | 24,593 |
| Medical facility–Outpatient or ER | 7,985 |
| Other | 4,771 |
| Hospice facility | 4,473 |
| Medical facility–Dead on arrival | 626 |
| Place of death unknown | 180 |
| Medical facility–Status unknown | 56 |
| Time Period | No. of deaths (≥65 years) | Age-adjusted mortality (≥65 years) | No. of deaths (<65 years) | Age-adjusted mortality (<65 years) |
|---|---|---|---|---|
| 1999–2003 | 12,236 | 7.0 | 2,705 | 0.2 |
| 2004–2008 | 12,088 | 6.3 | 2,907 | 0.2 |
| 2009–2013 | 13,949 | 6.5 | 3,330 | 0.2 |
| 2014–2018 | 26,148 | 10.8 | 4,760 | 0.3 |
| 2019–2023 | 62,441 | 23.9 | 7,770 | 0.5 |
≥, greater than or equal to; age-adjusted mortality, deaths per 100,000 population.
Age-based stratification
The number of deaths was consistently higher in the population above 65 years of age. The age adjusted death rate from 1999 to 2003 in this population was 7.0, which was followed by a decline to 6.8, from 2004 to 2008. After 2008, there was an increase, with a very prominent increase after 2014 reaching a rate of 23.9. For people below 65 years of age, the death rate due to hypertensive heart and renal disease remained relatively stable, reaching 0.5 during 2018 to 2023. The overall trend, shown in Table 2, clearly shows that as people age, the risk of death from these conditions increases substantially.
Mortality stratified by geographic region
The state-wise trends reveal considerable variation across the United States. Some states like Oklahoma, and Mississippi show notably higher age-adjusted rates, reaching as high as 24.4 and 8.1 in 2023, indicating a more pronounced issue with hypertension-related deaths. Meanwhile, states like Wyoming and Montana report the lowest rates, with an average AAMR (extracted from CDC WONDER) of 0.6 from 1999 to 2020. Other states such as California, Florida, and Michigan, fall in the middle, reflecting more moderate trends in the age-adjusted rates. Overall, while some states face greater challenges in managing hypertensive diseases, there is a general spread, with urbanized regions showing a broad but stable incidence, and rural or less urbanized regions tending to have higher mortality rates from these conditions.
Discussion
Our study has demonstrated an overall increase in mortality rate from hypertensive heart and renal disease from 1999 to 2023 across all races, genders, census regions and urbanization groups. Males had a consistently higher mortality rate as compared to females. Among different races, Blacks or African Americans had the highest mortality rates with the rapid increase in mortality rates of American Indians or Alaska Natives. Similarly, older adults had higher mortality rates as compared to younger individuals due to Hypertensive Heart and Renal Disease. Chronic elevation of blood pressure produces structural and functional changes in the heart and coronary arteries resulting in left ventricular hypertrophy, ultimately leading to heart failure and conduction abnormalities. Hypertensive heart disease is a constellation of these abnormalities [17]. Similarly chronic elevation of blood pressure also damages the blood vessels in kidneys and leads to glomerular hypertrophy which precedes glomerulosclerosis [18]. These conditions can co-exist in people suffering from hypertension. Moreover, one condition can worsen the other . For example, CKD can also lead to heart failure and cardiac fibrosis in histology. Additionally, cardiovascular morbidity and mortality are inversely associated with kidney function [19,20].
Our study has demonstrated higher mortality rates in males as compared to females. It is consistent with the trends seen in other studies for hypertensive heart and renal disease. Raja et al. concluded that Men had higher AAMRs from hypertensive heart disease than women during 1999 to 2020 (overall AAMR men: 23.1; 95% CI: 23.0-23.1; women: 16.4; 95% CI: 16.3-16.4) [12]. It is also consistent with findings of another study that older men had higher mortality rates from hypertensive heart disease as compared to older women [21]. Similarly, males had higher mortality rates due to hypertension-related ESRD [22]. Men appear more susceptible to hypertensive kidney disease and renal function decline than women, as shown in a Chinese cohort. Women, by contrast, demonstrate relative protection from renal and cardiovascular consequences. However, these mechanistic insights derive from non-U.S. populations and may not fully explain the mortality patterns in our nationwide analysis. They should thus be considered plausible explanations rather than definitive causes [23,24,25].
Analysis of racial disparities reveals that African Americans are more likely to have both hypertensive heart disease and renal disease. This can be explained by the fact that the incidence of hypertension in this population is higher than in others. Some other factors, like tobacco use and incidence of diabetes, also support this finding in African Americans [26,12]. Some other studies have also supported higher in-hospital mortality rates of non-Hispanic Blacks as compared to their White counterparts due to poor control of hypertension. It is attributable to lack of access to primary care providers, compromised quality of care, and lesser insurance coverage [27,28].
Another important trend observed in our study is the decline in AAMR for females (APC = , 95% CI = to , p = 0.03) and males (APC = , 95% CI = to , p = 0.01) from 2021 to 2023. A similar pattern has been documented for mortality due to diabetes and hypertension, with AAMR decreasing from 96.86 in 2021 to 84.58 in 2023, corresponding to an APC of (95% CI: to ; p = 0.02) in females and (95% CI: to ; p = 0.02) in males [29]. In addition, a study by Waqas et al. reported that following the pandemic, overall hypertension-related death rates fell 4.0%, from 258.2 (2020–2021) to 247.9 (95% CI: 247.5–248.3) in the post-pandemic period [30].
The observed decline may be related to several factors, including changes in coding practices, competing mortality from COVID-19, and improved access to healthcare as services resumed after the pandemic. COVID-19 also likely altered the way hypertension-related conditions were recorded on death certificates, but the accuracy of these designations has not been systematically investigated [31]. Moreover, although CDC’s updated excess-death estimation method improves stability during and after the pandemic, mortality estimates for the most recent years remain uncertain due to prolonged COVID-19–related disruptions [32].
Inadequate control of blood pressure remains an important driver of mortality related to hypertension. NHANES III Linked Mortality Study demonstrates that both untreated and treated-but-uncontrolled hypertensive adults face significantly higher risks of all-cause and CVD-specific death as compared to those with controlled hypertension who do not show excess mortality risk [33]. This highlights the need for interventions to ensure proper blood pressure control, especially in high-risk groups.
The 2017 ACC/AHA guidelines tightened the threshold and lowered the recommended goal to <130/80 mmHg for most patients; mortality trends from 2018 to 2023 did not show any decrease in deaths due to hypertensive heart and renal disease. Looking at the mortality trends, it does not appear that the guideline change has had a measurable impact on them so far, and more years of data will likely be required to determine whether a meaningful impact emerges over time [34].
Our findings highlight the urgent need for targeted interventions to eliminate gender-based and racial disparities in rising mortality rates due to hypertension-related heart and renal disease. Some studies have highlighted the causes of these disparities and suggested solutions [35,36,30]. However, data is limited, and future research should focus more on exploring the underlying causes of sex, racial, and regional disparities and ways to eliminate these disparities. Additionally, prospective studies should be conducted to determine the long-term impact of changes in post-pandemic access to health care delivery.
Future work should explore the potential positive impact of hypertension-related awareness, anti-hypertensive treatment, and control on mortality rates [37]. Integration of social determinants of health can help identify vulnerable groups and target interventions to them [37]. By addressing these research gaps, evidence-based policies can be constituted to target groups affected by hypertension-related heart disease and renal disease.
This nationwide study, using CDC WONDER data, analyzes age-adjusted mortality trends for hypertensive heart and renal disease (I13) but has some limitations. The analysis is subject to cause-of-death misclassification due to the use of death certificate data, which may affect mortality estimates. In addition, by focusing solely on ICD-10 I13, which shows hypertensive heart and renal disease, the analysis may underestimate the broader burden of isolated hypertensive heart or renal disease. Moreover, using the 2013 urban–rural scheme across all years may misclassify counties that changed over time, which should be considered when interpreting long-term trends. Additionally, mortality data for 2022–2023 were provisional and obtained from the most recent CDC WONDER release, and trends in these final years may change as data are updated and finalized. The short duration of certain trend segments, including those overlapping the COVID-19 period, may contribute to instability in APC estimates, which represents an inherent limitation of annual mortality data. In this study, a small proportion of records contained missing demographic or geographic information, which represents an additional limitation of the subgroup analyses. This analysis lacks individual-level data on risk factors such as blood pressure control, medication use, socioeconomic status, and comorbidities, which limits the ability to adjust for underlying clinical and social determinants of mortality.
Conclusions
From 1999 to 2023, mortality due to hypertensive heart and renal disease has risen significantly across the United States, increasing from an AAMR of 1.2 to 4.2. Misclassification and the absence of individual-level clinical or socioeconomic data may influence the observed trends, but the early years showed relative stability, and since the early 2010s, a sustained upward trend has emerged, particularly in the South and Midwest regions, among males, and among African Americans. It highlights persistent health disparities and the need for targeted interventions to improve hypertension management. Future research must prioritize identifying and eliminating disparities in hypertension-related mortality through targeted interventions and integrating social determinants into evidence-based policies.
Conflicts of Interest
The authors declare no conflicts of interest.
Funding Source
No funding sources were used.
Acknowledgments
No acknowledgements.
Institutional Review Board (IRB)
This study used publicly available, de-identified CDC data and did not require IRB approval.
Large Language Model
No AI or large-language model tools were used in the writing, editing, or preparation of this manuscript.
Authors Contribution
Conceptualization was performed by AJ, FR, Methodology was carried out by AJ, FR, Data curation involved AJ, FR, AM, HR, Formal analysis was conducted by AJ, FR, Writing of the original draft was completed by AJ, FR, BN, MA, Writing review and editing were undertaken by AJ, FR, BN, MA, Supervision was provided by JM
Data Availability
All data used in this study are publicly available from the CDC Wide-ranging Online Data for Epidemiologic Research (CDC WONDER) database.
References
- Fuchs F. D., Whelton P. K.. High Blood Pressure and Cardiovascular Disease. Hypertension. 2020;75(2):285-292. doi:10.1161/HYPERTENSIONAHA.119.14240 PMID: 31865786 PMCID: PMC10243231
- Writing Group Members, Mozaffarian D., Benjamin E. J., Go A. S., Arnett D. K., Blaha M. J., Cushman M., Das S. R., de Ferranti S., Despres J. P., Fullerton H. J., Howard V. J., Huffman M. D., Isasi C. R., Jimenez M. C., Judd S. E., Kissela B. M., Lichtman J. H., Lisabeth L. D., Liu S., Mackey R. H., Magid D. J., McGuire D. K., Mohler E. R., 3rd, Moy C. S., Muntner P., Mussolino M. E., Nasir K., Neumar R. W., Nichol G., Palaniappan L., Pandey D. K., Reeves M. J., Rodriguez C. J., Rosamond W., Sorlie P. D., Stein J., Towfighi A., Turan T. N., Virani S. S., Woo D., Yeh R. W., Turner M. B., American Heart Association Statistics Committee and Stroke Statistics Subcommittee. Heart Disease and Stroke Statistics-2016 Update: A Report From the American Heart Association. Circulation. 2016;133(4):e38-360. doi:10.1161/CIR.0000000000000350 PMID: 26673558
- Unger T., Borghi C., Charchar F., Khan N. A., Poulter N. R., Prabhakaran D., Ramirez A., Schlaich M., Stergiou G. S., Tomaszewski M., Wainford R. D., Williams B., Schutte A. E.. 2020 International Society of Hypertension Global Hypertension Practice Guidelines. Hypertension. 2020;75(6):1334-1357. doi:10.1161/HYPERTENSIONAHA.120.15026 PMID: 32370572
- Fryar C. D., Kit B., Carroll M. D., Afful J.. Hypertension prevalence, awareness, treatment, and control among adults age 18 and older: United States, August 2021-August 2023. 2024.
- United States Department of Health and Human Services. Healthy People 2030: Reduce the proportion of adults with high blood pressure. 2025.
- Cuspidi C., Ambrosioni E., Mancia G., Pessina A. C., Trimarco B., Zanchetti A., APROS Investigators. Role of echocardiography and carotid ultrasonography in stratifying risk in patients with essential hypertension: the Assessment of Prognostic Risk Observational Survey. J Hypertens. 2002;20(7):1307-14. doi:10.1097/00004872-200207000-00017 PMID: 12131527
- Cuspidi C., Valerio C., Negri F., Sala C., Masaidi M., Giudici V., Zanchetti A., Mancia G.. Prevalence and correlates of multiple organ damage in referred treated hypertensives: data from the ETODH study. J Hum Hypertens. 2008;22(11):801-3. doi:10.1038/jhh.2008.56 PMID: 18528408
- Dumitrescu M., Constantin A., Nemecz A. M., Dragan E., Popov L. D., Tanko G.. Hypertension induces compensatory left ventricular hypertrophy by a mechanism involving gap junction lateralization and overexpression of CD36, PKC and MMP-2. Rom J Morphol Embryol. 2021;62(3):713-721. doi:10.47162/RJME.62.3.08 PMID: 35263399 PMCID: PMC9019672
- Bidani A. K., Griffin K. A.. Pathophysiology of hypertensive renal damage: implications for therapy. Hypertension. 2004;44(5):595-601. doi:10.1161/01.HYP.0000145180.38707.84 PMID: 15452024
- Centers for Disease Control and Prevention. CDC WONDER.
- Abughazaleh Saeed, Tarawneh Mohammad, Nawaiseh Ahmad M. Al, Obeidat Omar, Qadadeh Ziad, Pondicherry-Harish Roja C.. Trends in Hypertensive Heart Disease Associated Mortality in the United States: A Population-Based Time-Trend Analysis Using the Global Burden of Diseases Database, 1990-2019. Journal of the American College of Cardiology. 2024;83(13). doi:10.1016/s0735-1097(24)03861-0
- Raja A., Raja S., Amin S. B., Salman M., Azeem B., Kumar L.. Temporal trends in hypertension related end stage renal disease mortality rates: an analysis of gender, race/ethnicity, and geographic disparities in the United States. Front Nephrol. 2023;3:1339312. doi:10.3389/fneph.2023.1339312 PMID: 38288382 PMCID: PMC10823365
- Aggarwal R., Chiu N., Loccoh E. C., Kazi D. S., Yeh R. W., Wadhera R. K.. Rural-Urban Disparities: Diabetes, Hypertension, Heart Disease, and Stroke Mortality Among Black and White Adults, 1999-2018. J Am Coll Cardiol. 2021;77(11):1480-1481. doi:10.1016/j.jacc.2021.01.032 PMID: 33736831 PMCID: PMC8210746
- Centers for Disease Control and Prevention, National Center for Health Statistics. NCHS urban-rural classification scheme for counties. 2024.
- Anderson R. N., Rosenberg H. M.. Age standardization of death rates: implementation of the year 2000 standard. 1998.
- National Cancer Institute. Joinpoint Regression Program.
- Tackling G., Borhade M. B.. Hypertensive heart disease. StatPearls. 2025.
- Hughson M. D., Puelles V. G., Hoy W. E., Douglas-Denton R. N., Mott S. A., Bertram J. F.. Hypertension, glomerular hypertrophy and nephrosclerosis: the effect of race. Nephrol Dial Transplant. 2014;29(7):1399-409. doi:10.1093/ndt/gft480 PMID: 24327566 PMCID: PMC4071048
- Law J. P., Pickup L., Pavlovic D., Townend J. N., Ferro C. J.. Hypertension and cardiomyopathy associated with chronic kidney disease: epidemiology, pathogenesis and treatment considerations. J Hum Hypertens. 2023;37(1):1-19. doi:10.1038/s41371-022-00751-4 PMID: 36138105 PMCID: PMC9831930
- Zannad F., Rossignol P.. Cardiorenal Syndrome Revisited. Circulation. 2018;138(9):929-944. doi:10.1161/CIRCULATIONAHA.117.028814 PMID: 30354446
- Arshad M. S., Tharwani Z. H., Deepak F. N. U., Abdullah A., Kumar R., Bhimani R. K., Sagar R. S., Bhimani P. D., Raja A., Parkash O., Sohail M. U., Memon M. M.. Trends in hypertensive heart disease-related mortality among older adults in the USA: a retrospective analysis from CDC WONDER between 1999 and 2020. Egypt Heart J. 2025;77(1):27. doi:10.1186/s43044-025-00622-6 PMID: 40035900 PMCID: PMC11880464
- Ayyan Muhammad, Amir Saim, Zahid Afra, Naveed Aiman, Umer Mohammad, Siddique Muhammad Uzair, Rehman Wajeeh, Dani Sourbha. Abstract 4147016: Trends in Hypertension-related End-Stage Renal Disease (ESRD) across the United States from 1999-2022: An Analysis of Age, Gender, and Ethnic Disparities. Circulation. 2024;150(Suppl_1). doi:10.1161/circ.150.suppl_1.4147016
- Baiardi G., Macova M., Armando I., Ando H., Tyurmin D., Saavedra J. M.. Estrogen upregulates renal angiotensin II AT1 and AT2 receptors in the rat. Regul Pept. 2005;124(1-3):7-17. doi:10.1016/j.regpep.2004.06.021 PMID: 15544836
- Gillis E. E., Sullivan J. C.. Sex Differences in Hypertension: Recent Advances. Hypertension. 2016;68(6):1322-1327. doi:10.1161/HYPERTENSIONAHA.116.06602 PMID: 27777357 PMCID: PMC5159215
- Wang Q., Xie D., Xu X., Qin X., Tang G., Wang B., Wang Y., Hou F., Xu X., Wang X.. Blood pressure and renal function decline: a 7-year prospective cohort study in middle-aged rural Chinese men and women. J Hypertens. 2015;33(1):136-43. doi:10.1097/HJH.0000000000000360 PMID: 25255396
- Lea Janice P.. Racial Disparities in Hypertensive Cardiovascular Disease and Chronic Kidney Disease. The FASEB Journal. 2010;24(S1). doi:10.1096/fasebj.24.1_supplement.409.1
- Noah G. U., Omohoro M. U., Magacha H. M., Fuko C. D., Ezike T.. Racial Disparities in Hypertension-Related Hospital Mortality Among Adults in the United States. Cureus. 2025;17(3):e81043. doi:10.7759/cureus.81043 PMID: 40264630 PMCID: PMC12014224
- Williams D. R., Mohammed S. A.. Racism and Health I: Pathways and Scientific Evidence. Am Behav Sci. 2013;57(8). doi:10.1177/0002764213487340 PMID: 24347666 PMCID: PMC3863357
- Hashmi S., Safdar I., Kazmi M. H., Zulfiqar E., Shahzad M., Hurjkaliani S., Ayyad M., Zuberi N., Ahmed T., Sujay G. B., Talal H., Kazmi S. H., Khan M. F., Imbianozor G., Ahmed M., Ahmed R.. Rising Mortality Related to Diabetes Mellitus and Hypertension: Trends and Disparities in the United States (1999-2023). Clin Cardiol. 2025;48(4):e70132. doi:10.1002/clc.70132 PMID: 40237249 PMCID: PMC12000922
- Waqas S. A., Hurjkaliani S., Salim H., Collins P., Ahmed R.. Post-COVID shifts and disparities in hypertension-related mortality in the United States. Ann Epidemiol. 2025;107:20-23. doi:10.1016/j.annepidem.2025.05.010 PMID: 40412631
- Vaughan A. S., Coronado F., Casper M., Loustalot F., Wright J. S.. County-Level Trends in Hypertension-Related Cardiovascular Disease Mortality-United States, 2000 to 2019. J Am Heart Assoc. 2022;11(7):e024785. doi:10.1161/JAHA.121.024785 PMID: 35301870 PMCID: PMC9075476
- Centers for Disease Control and Prevention. Excess Deaths Associated with COVID-19. 2022.
- Zhou D., Xi B., Zhao M., Wang L., Veeranki S. P.. Uncontrolled hypertension increases risk of all-cause and cardiovascular disease mortality in US adults: the NHANES III Linked Mortality Study. Sci Rep. 2018;8(1):9418. doi:10.1038/s41598-018-27377-2 PMID: 29925884 PMCID: PMC6010458
- Reboussin D. M., Allen N. B., Griswold M. E., Guallar E., Hong Y., Lackland D. T., Miller E. P. R., 3rd, Polonsky T., Thompson-Paul A. M., Vupputuri S.. Systematic Review for the 2017 ACC/AHA/AAPA/ABC/ACPM/AGS/APhA/ASH/ASPC/NMA/PCNA Guideline for the Prevention, Detection, Evaluation, and Management of High Blood Pressure in Adults: A Report of the American College of Cardiology/American Heart Association Task Force on Clinical Practice Guidelines. Hypertension. 2018;71(6):e116-e135. doi:10.1161/HYP.0000000000000067 PMID: 29133355
- Ferdinand K. C., Nasser S. A.. Racial/ethnic disparities in prevalence and care of patients with type 2 diabetes mellitus. Curr Med Res Opin. 2015;31(5):913-23. doi:10.1185/03007995.2015.1029894 PMID: 25772230
- Jafar T. H., Hatcher J., Poulter N., Islam M., Hashmi S., Qadri Z., Bux R., Khan A., Jafary F. H., Hameed A., Khan A., Badruddin S. H., Chaturvedi N., Hypertension Research Group. Community-based interventions to promote blood pressure control in a developing country: a cluster randomized trial. Ann Intern Med. 2009;151(9):593-601. doi:10.7326/0003-4819-151-9-200911030-00004 PMID: 19884620
- Mills K. T., Bundy J. D., Kelly T. N., Reed J. E., Kearney P. M., Reynolds K., Chen J., He J.. Global Disparities of Hypertension Prevalence and Control: A Systematic Analysis of Population-Based Studies From 90 Countries. Circulation. 2016;134(6):441-50. doi:10.1161/CIRCULATIONAHA.115.018912 PMID: 27502908 PMCID: PMC4979614